Earthdata GIS OPERA DSWx-HLS Image Service Access
Author(s): Nicholas Tarpinian, Catalina Taglialatela (NASA PO.DAAC)
Created: 2026-06-01
Last updated: 2026-06-23
Versions used: ArcGIS Pro 3.6.1
Summary
This guide shows how to connect using GIS applications to the recently released NASA Earthdata GIS (EGIS) Image Service for Observational Products for End-Users from Remote Sensing Analysis (OPERA) Dynamic Surface Water eXtent (DSWx) Harmonized Landsat Sentinel-2 (HLS), namely the OPERA_L3_DSWX-HLS_V1 collection.
For more details on these services and the latest available services, please visit the EGIS OPERA Image Service page.
Learning Objectives:
- Connecting to the OPERA DSWx-HLS Image Service through the Map Viewer and ArcGIS Pro (QGIS has limitations - see end of tutorial).
- Exploring the collection metadata and visualizing the data in an interactive map.
Map Viewer
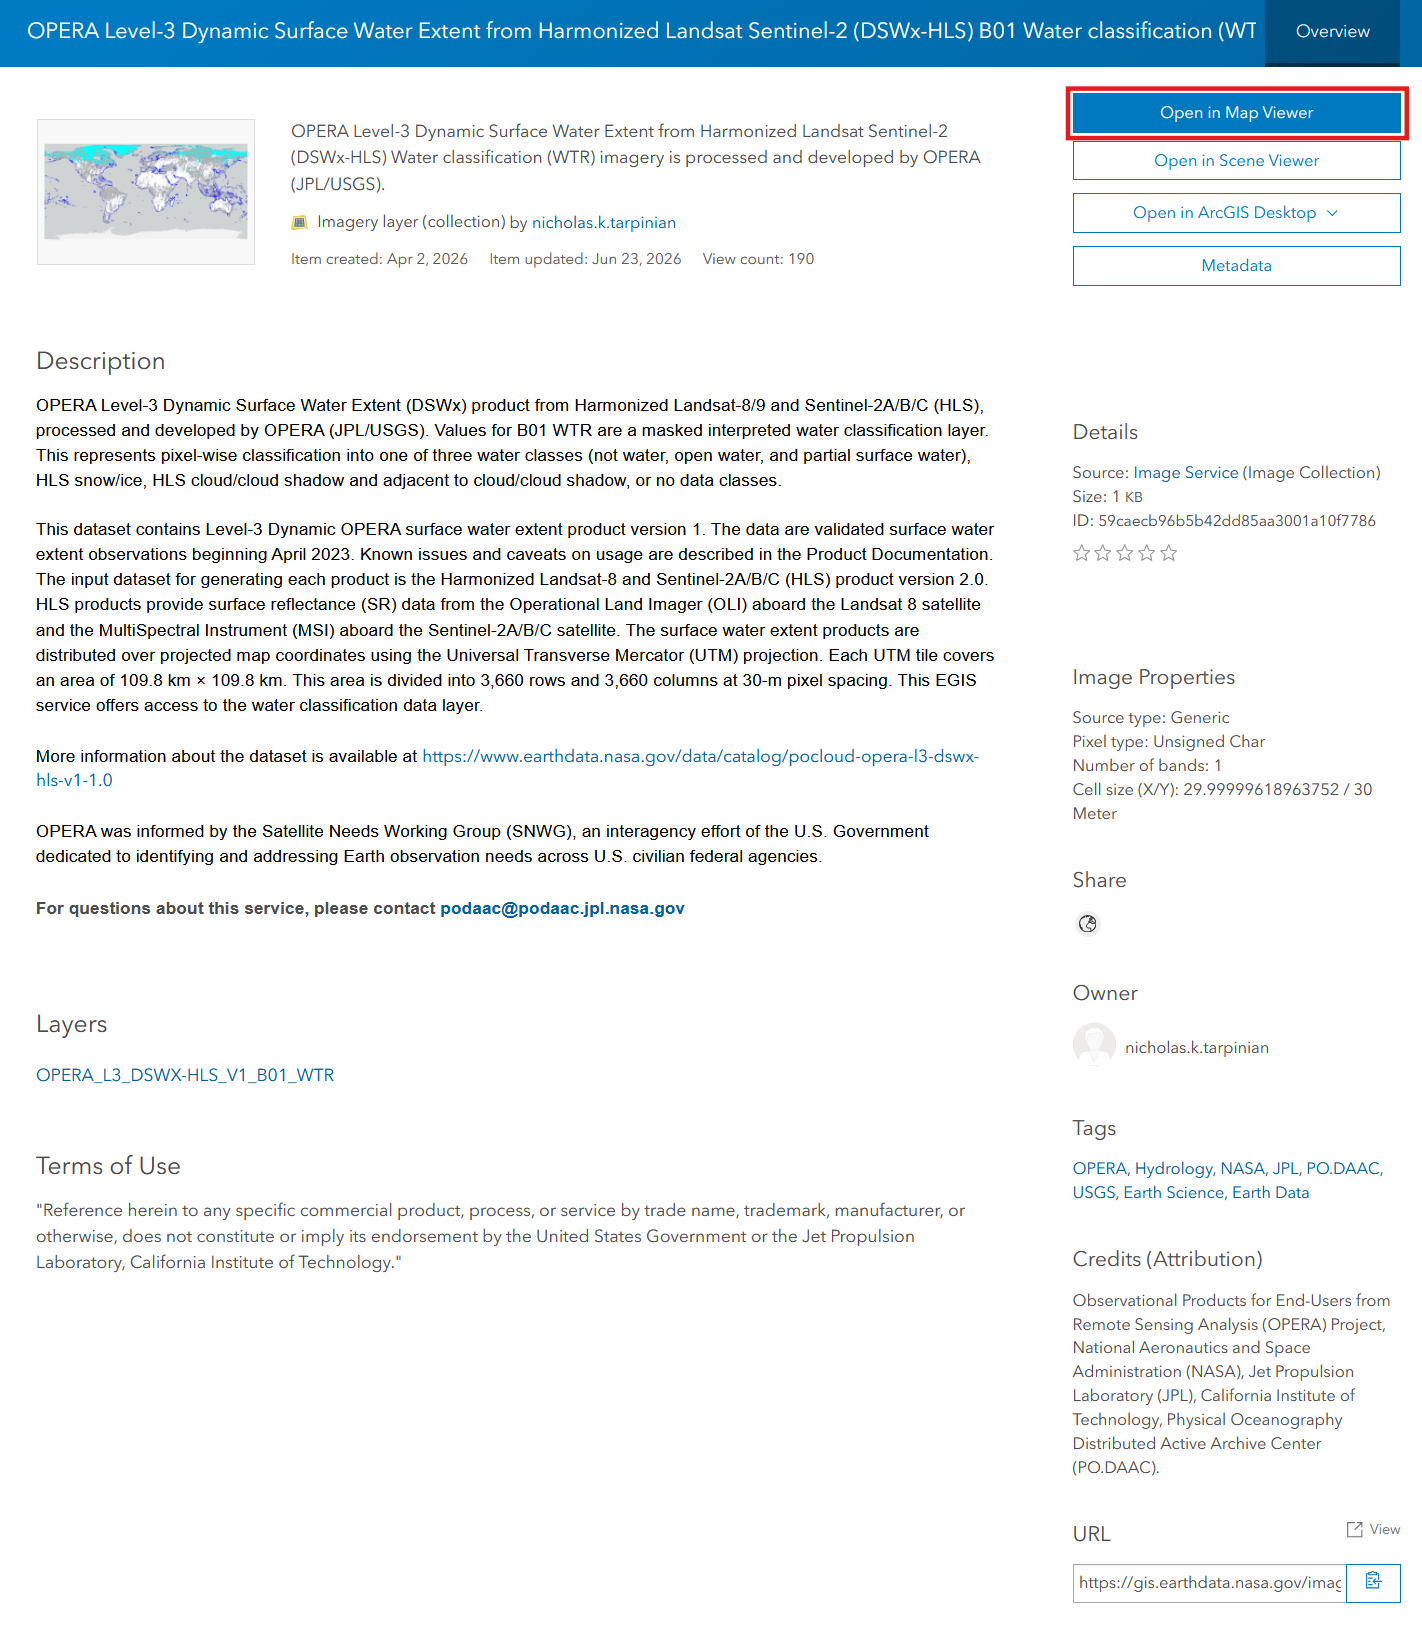
You can quickly view the OPERA DSWx-HLS Image Service through the dataset landing page (WTR landing page, CONF landing page) by selecting Open in Map Viewer.
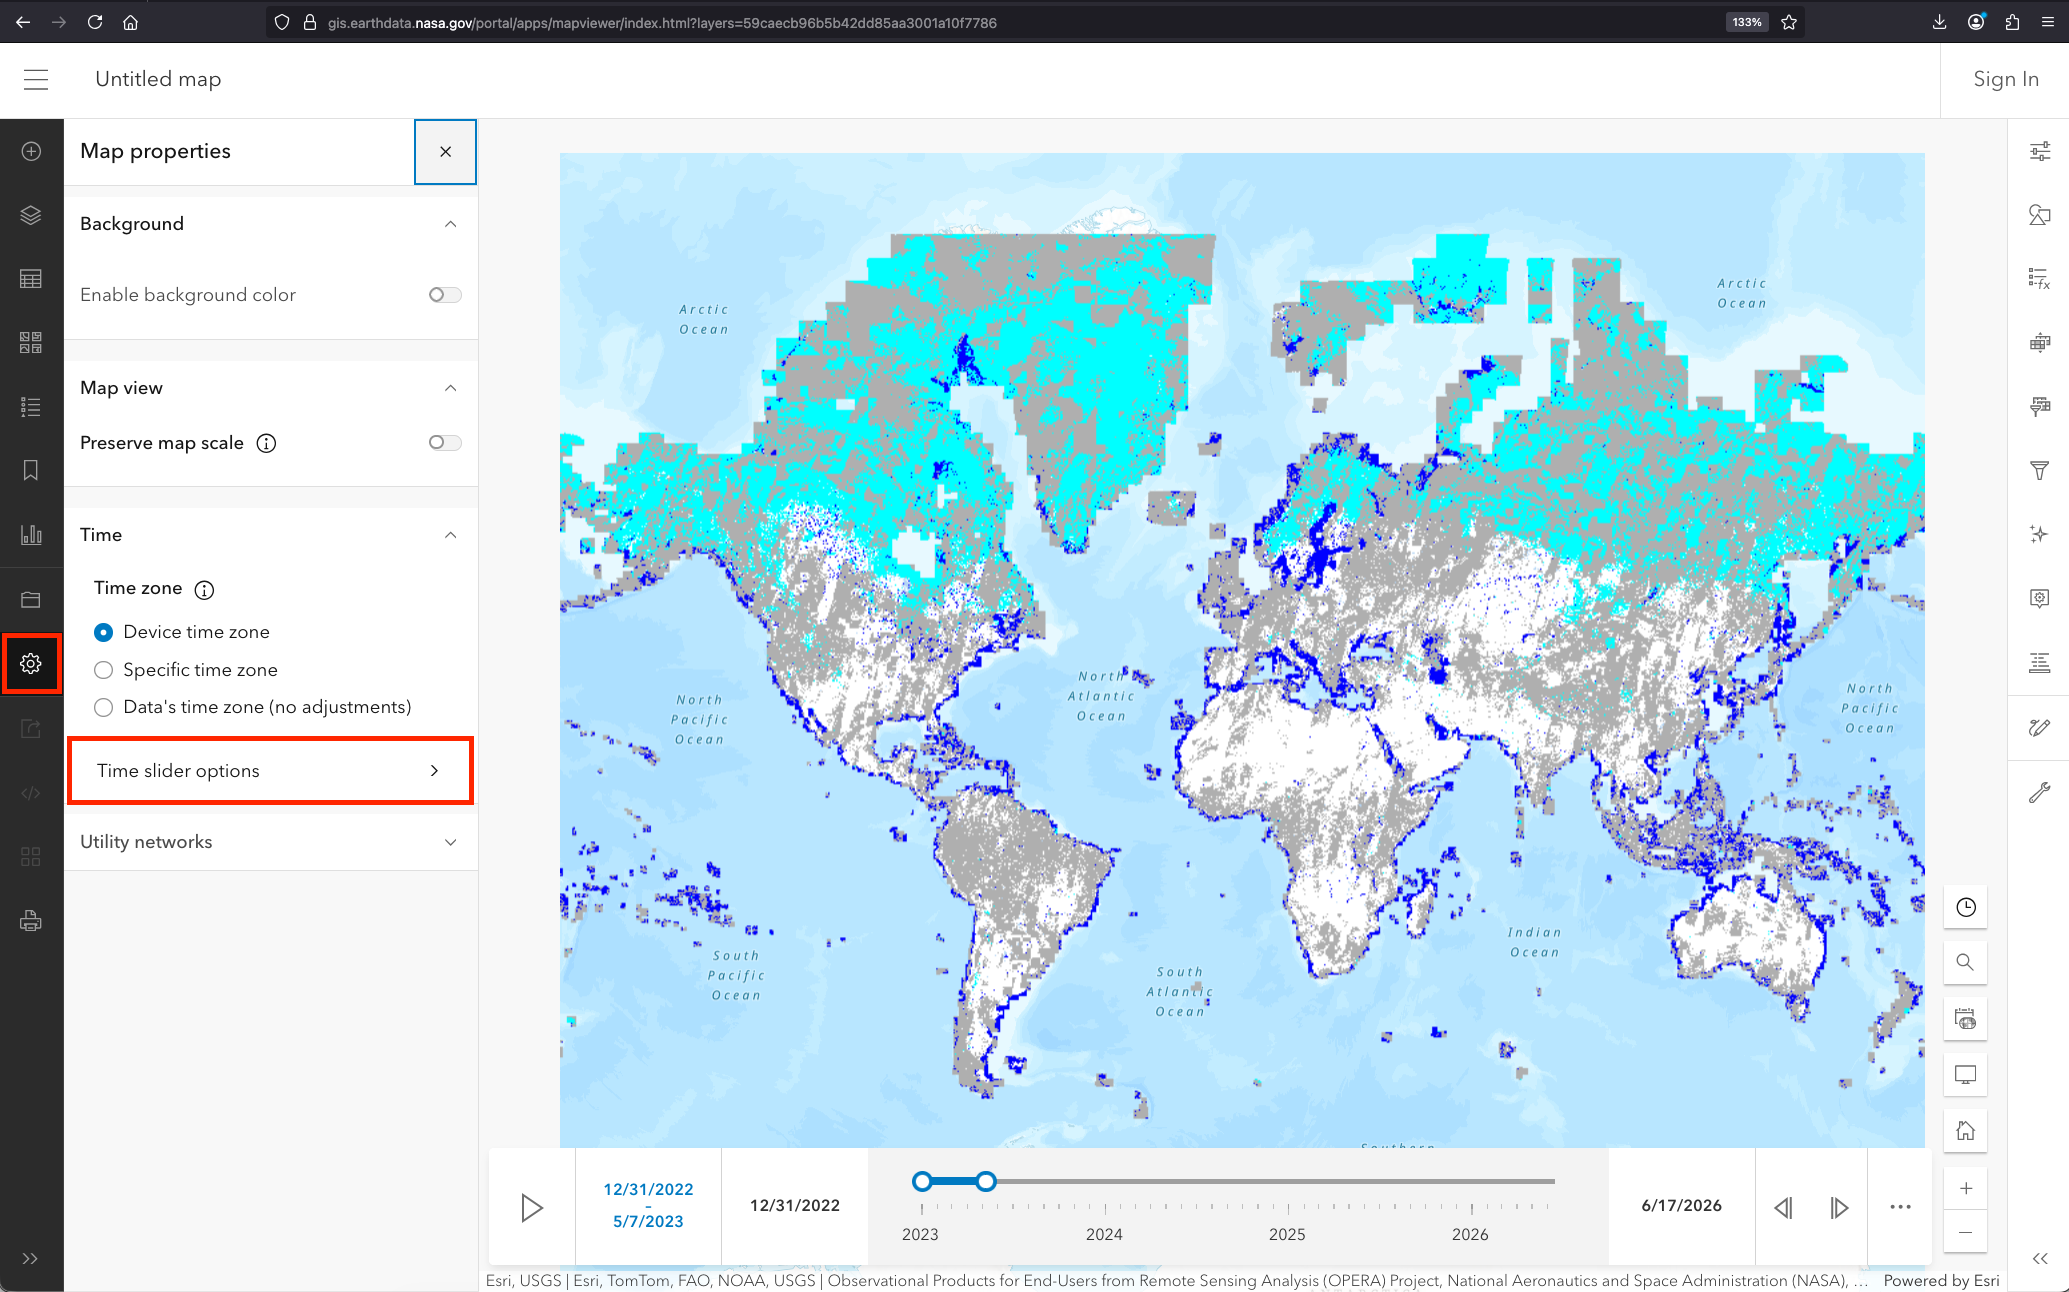
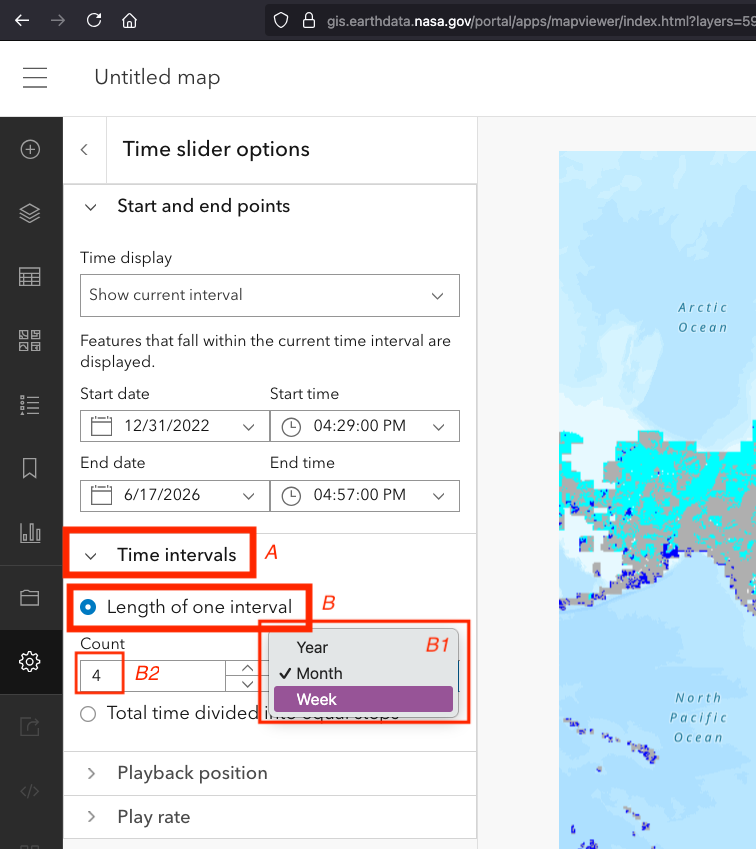
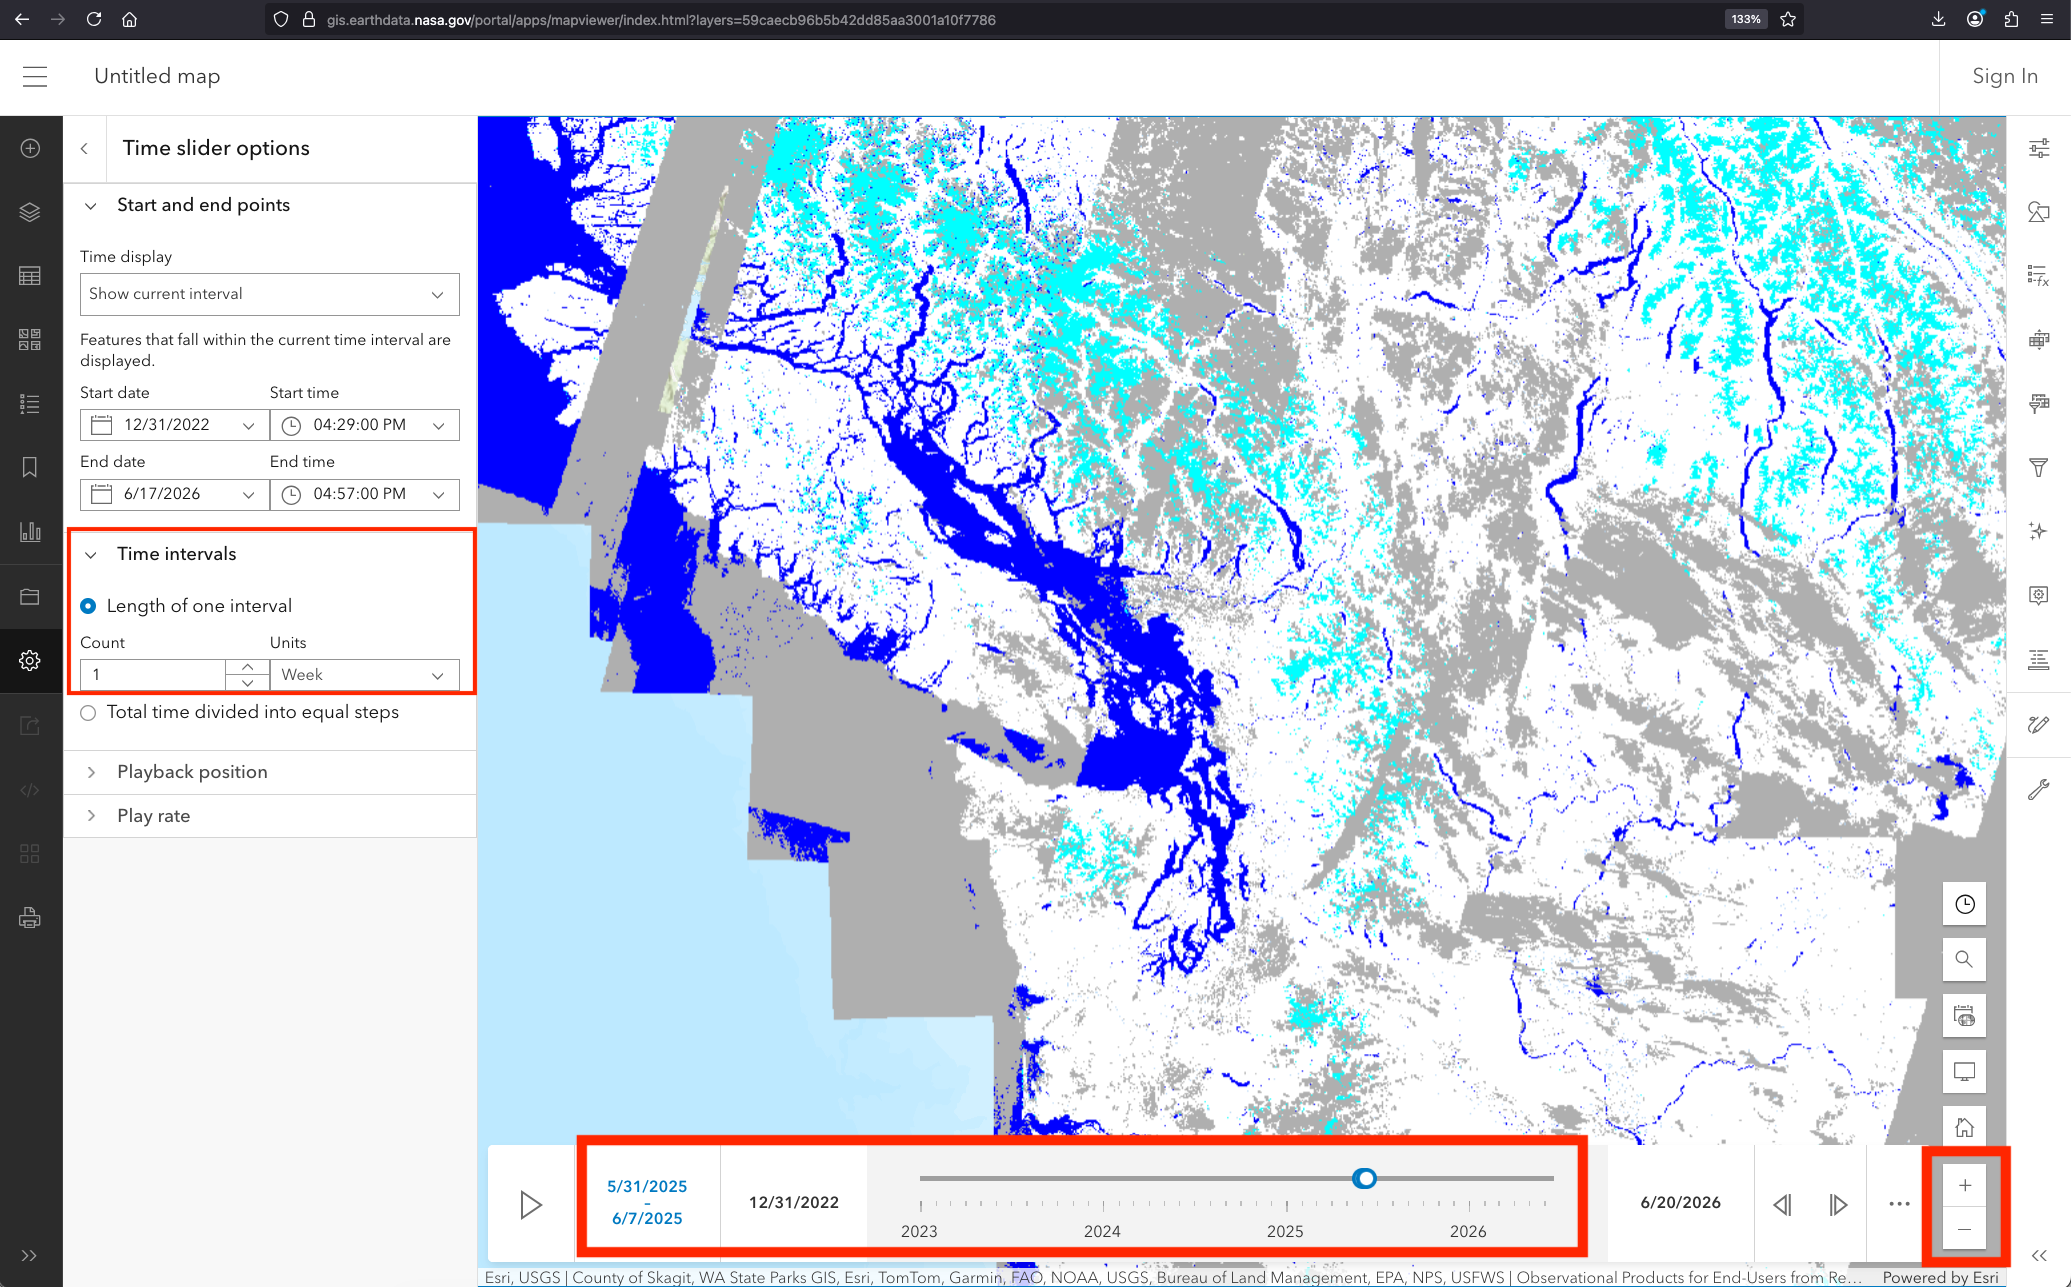
Once open, data may be slow to load due to the size. Tips for rendering data faster and for adjusting spatial and temporal zoom: (i) adjust the time interval by clicking Map Properties (gear icon) on left hand side, Time > Time slider options, and adjust Time intervals (A) > Length of one interval (B) to e.g. week (B1), and 1 day (B2) or desired interval. You can also adjust the spatial zoom level over a region of interest. This is shown in the screenshots below.
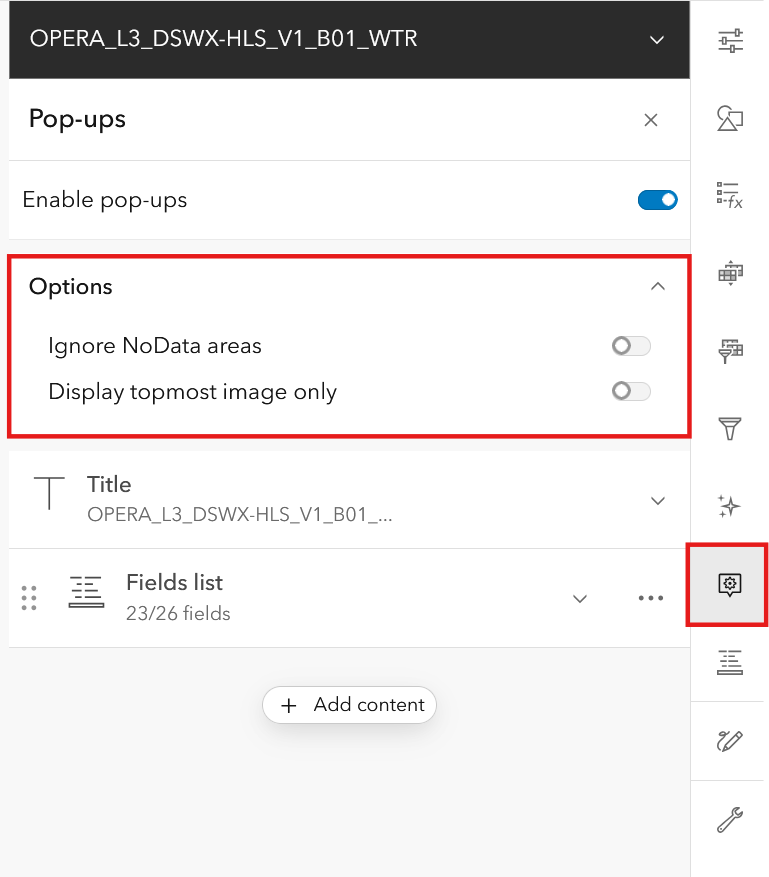
For the pop-ups to display correctly when selecting a granule: on the right hand side, select the Pop-ups option; then de-select both Ignore NoData areas and Display topmost image only to get all availble observations for the selected granule.
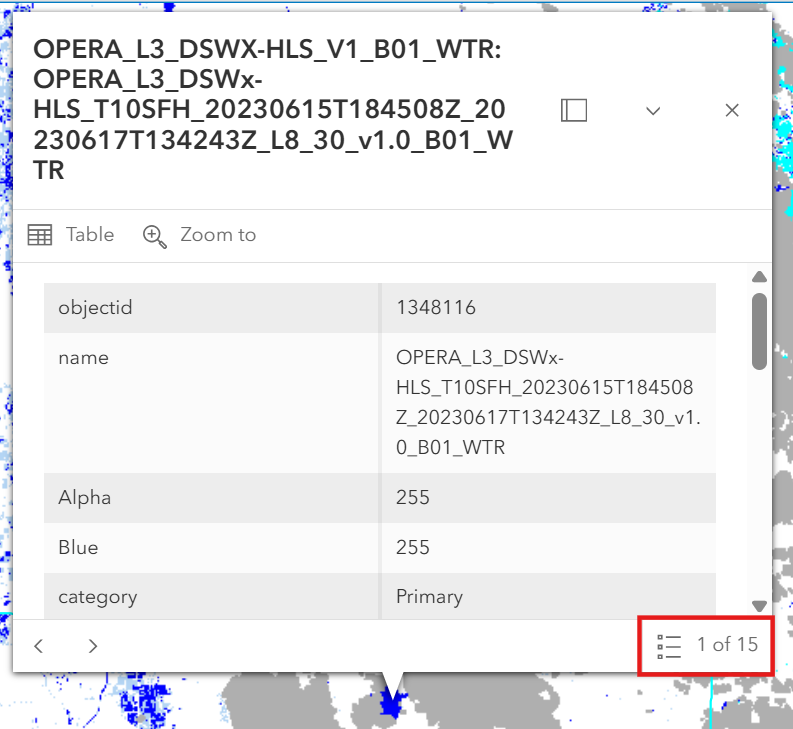
The inital view once loaded will showcase the overview layer. When zooming in, the source raster will become available on the area of interest. Selecting a granule will pop up the granule attributes with the latest observations. In the corner of the pop-up, it will highlight the record amount available based on the time scale selected.
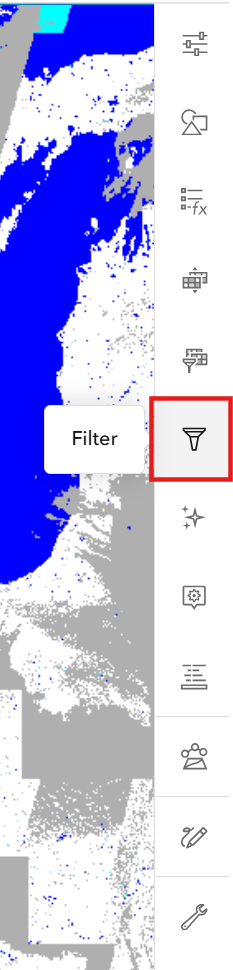
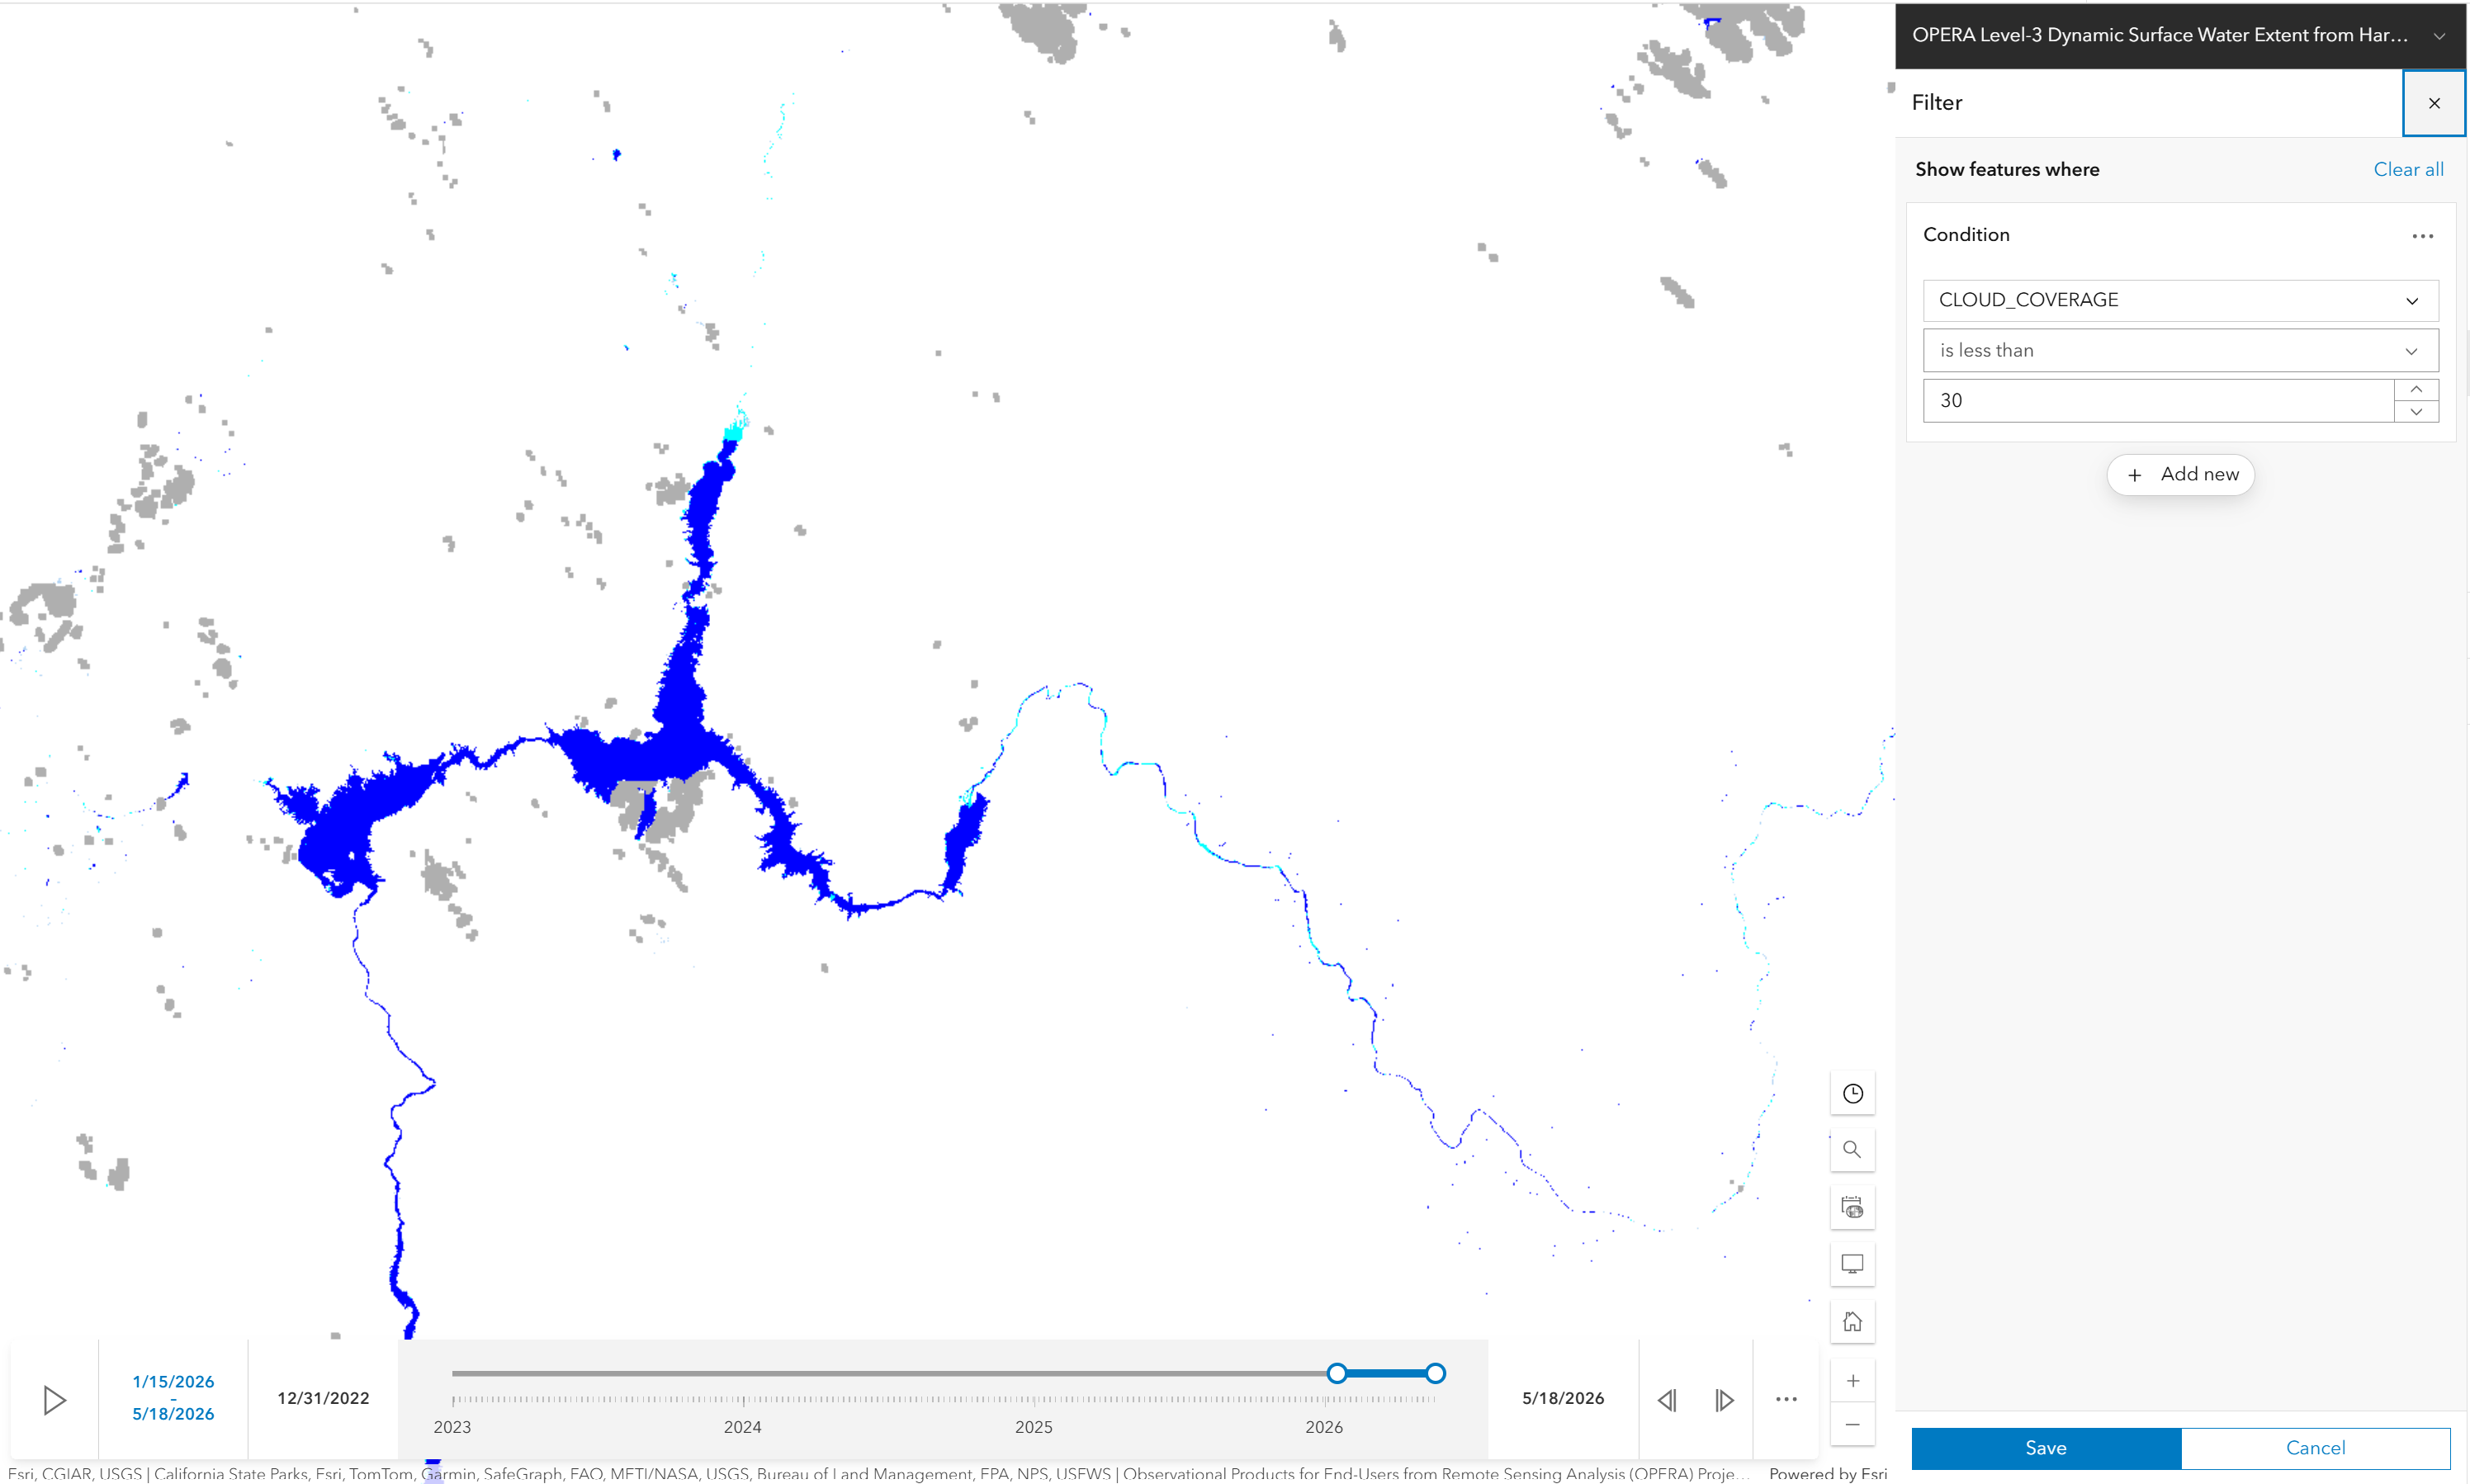
To further explore the data, you can filter/query the data by selecting the Filter option on the right hand side. This will allow you to query the data based on the available attributes.
ArcGIS Pro
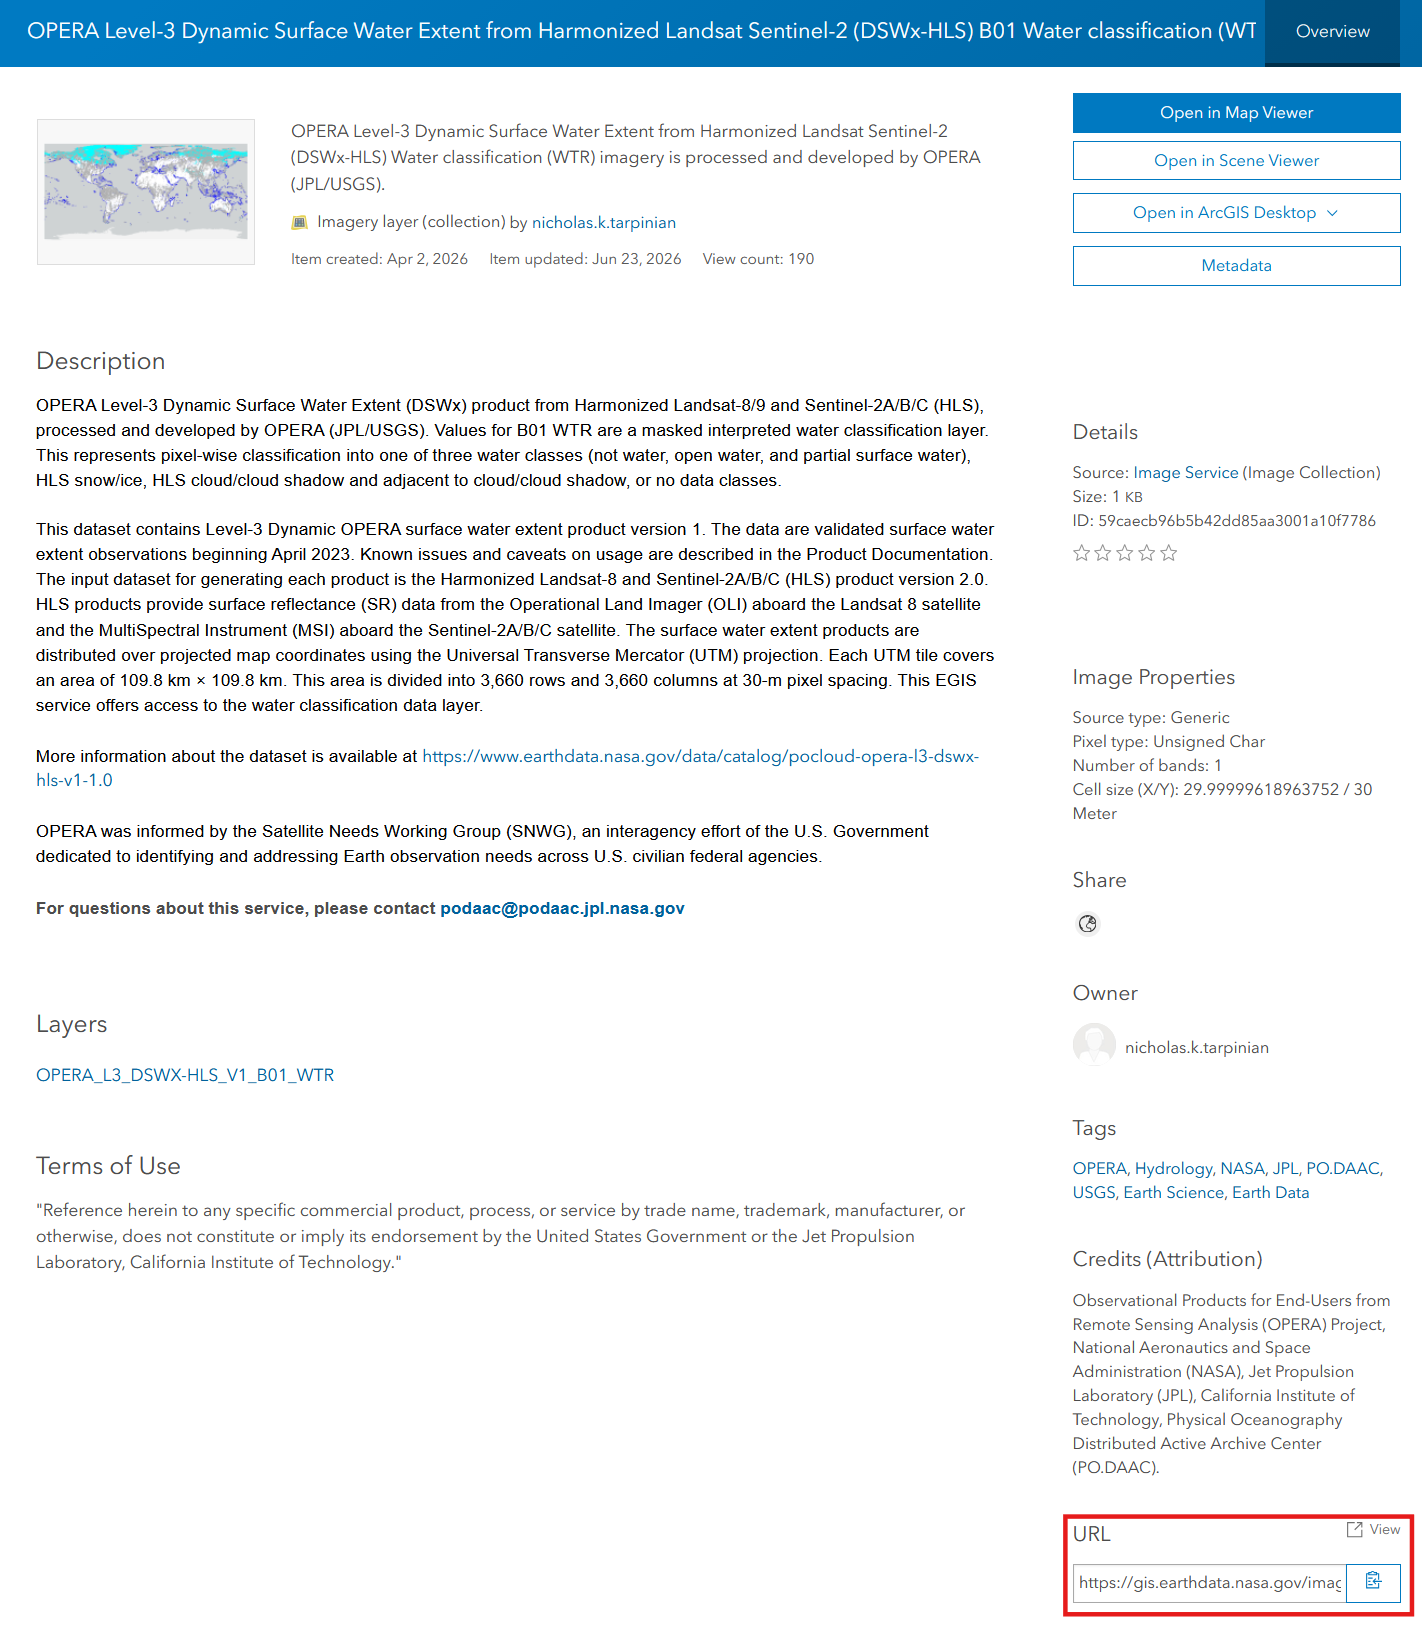
To connect to the Image Service in ArcGIS Pro, first grab the endpoint URL: https://gis.earthdata.nasa.gov/image/rest/services/C2617126679-POCLOUD/OPERA_L3_DSWX-HLS_V1_B01_WTR/ImageServer from the dataset landing page as shown in the image below:
Next step is to open ArcGIS Pro and select the Add Data tab.
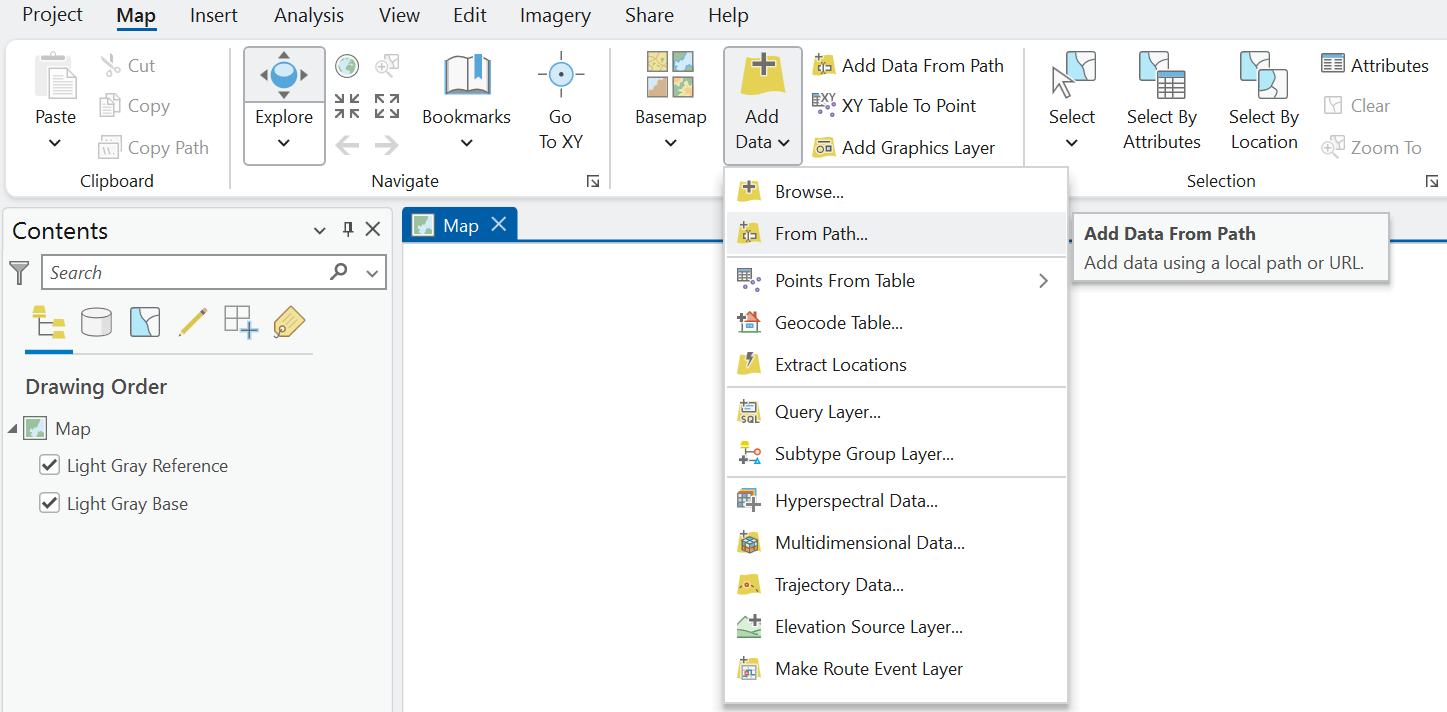
Then within the Add Data section you have the option of loading the Image Service of the REST endpoint From Path.
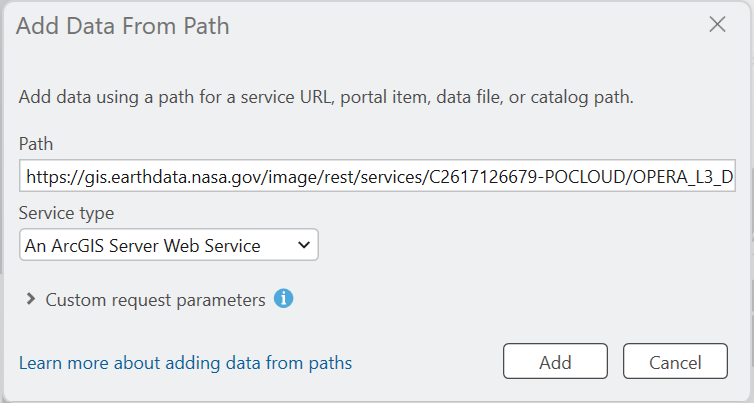
Then entering the Image Service endpoint within the Path.
Once the data is added to the map, you can start exploring the Image Service.
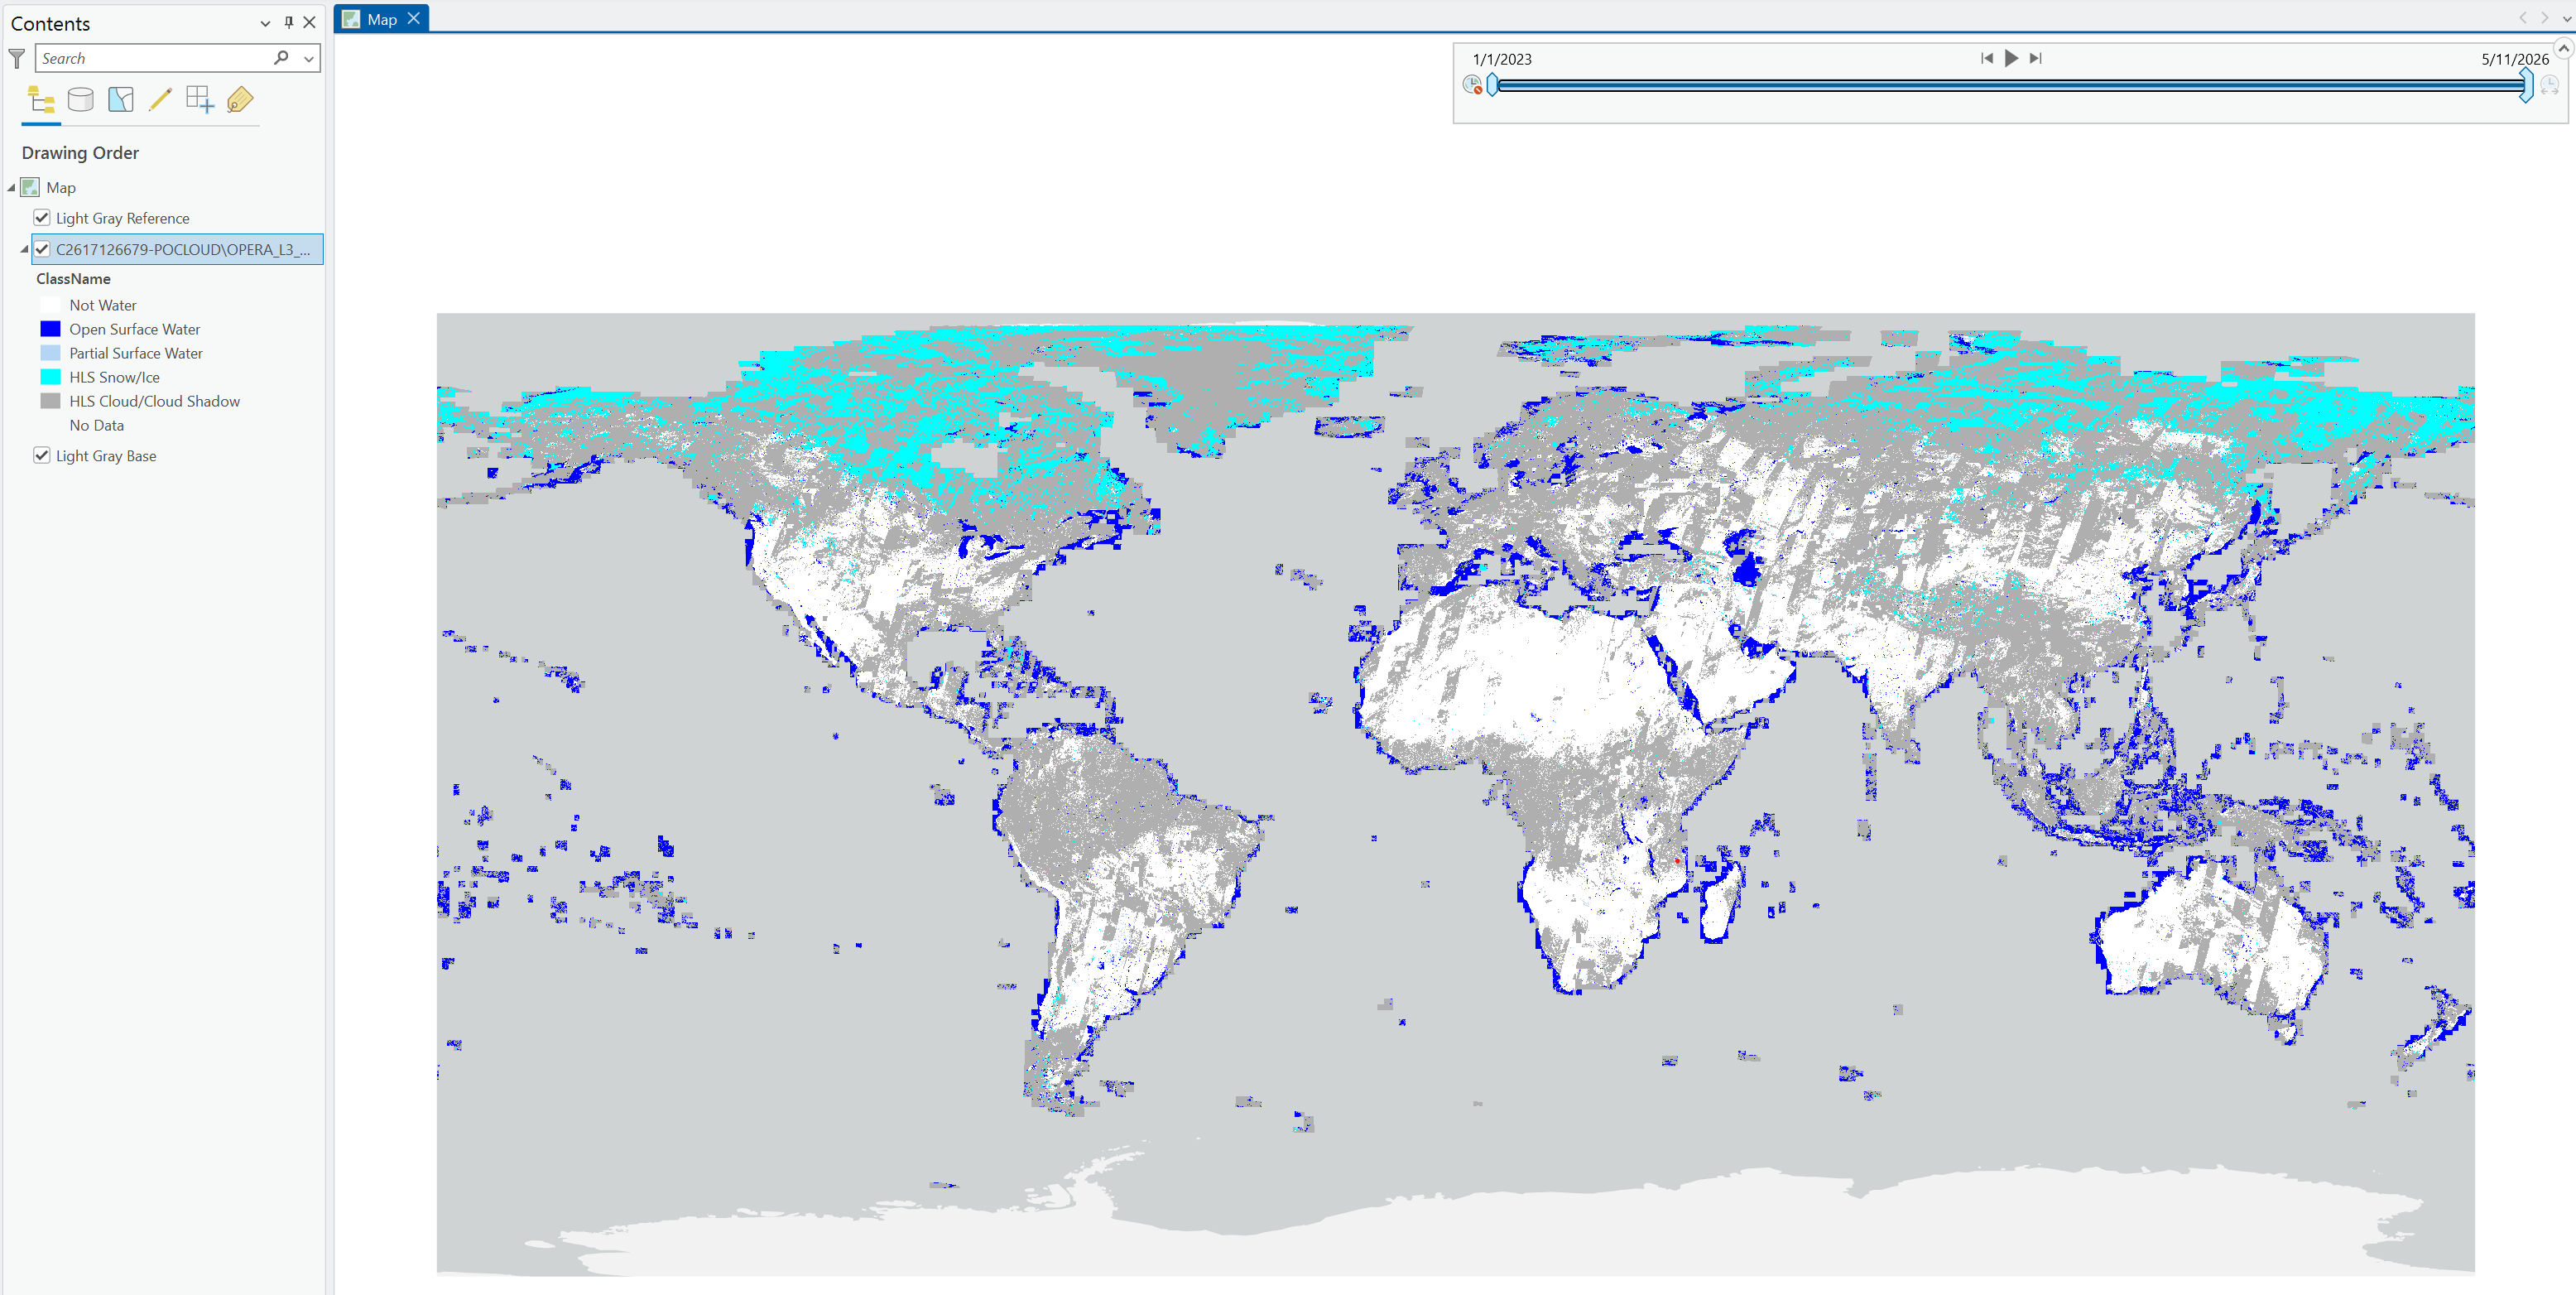
The OPERA_L3_DSWX-HLS_V1_B01_WTR is best observed with a reduced time scale (e.g. using the time slider). Overview layers will be available to view at a global extent of the collection, but the source raster will only be available when zoomed in.
Please note: If querying via Select By Attributes, certain queries may timeout depending on the attribute/variable used due to the amount of records.
QGIS
There are current limitations with connecting to the Image Service in QGIS.
Visit this StoryMap for more details on the limitations of QGIS accessibility.
Programmatic Access
For programmatic access examples, see OPERA_EGIS_access_Python.ipynb in the PO.DAAC Cookbook.
For a science use case demonstrating surface water extent time series analysis, see OPERA_EGIS_access_Python_LakeMead_timeseries.ipynb in the PO.DAAC Cookbook.