import glob
from netCDF4 import Dataset
import xarray as xr
import numpy as np
import matplotlib.pyplot as plt

import gsw
S-MODE Workshop: Science Case Study In Situ
imported on: 2026-07-08
This notebook is from a different repository in NASA’s PO.DAAC, 2022-SMODE-Open-Data-Workshop
The original source for this document is https://github.com/podaac/2022-SMODE-Open-Data-Workshop/blob/main/notebooks/insitu_dataviz_demo.ipynb
S-MODE Data Workshop: in-situ data demo
This is a simple demo of a workflow for downloading and working with S-MODE in-situ data. We will work with underway data collected by saildrones and R/V Oceanus during the S-MODE Pilot Campaign.
If you have any questions, do not hesitate in contacting me (cesar.rocha@uconn.edu).
Road map
- Download saildrone data
- Load and plot single dataset (one saildrone)
- Load and merge multiple datasets (five saildrones)
- Compare saildrone ADCP data with R/V Oceanus ADCP data
First, download the saildrone data
The saildrone data are organized into two different sets of files: ADCP (velocity measurements) and NON-ADCP (everything else). The ADCP data are available in 5-minute averages. The NON-ADCP data are available in 1-minute averages.
# constants for podaac-data-downloader
start_time = '2021-10-20T00:00:00Z'
end_time = '2021-11-08T00:00:00Z'
short_name = 'SMODE_LX_SAILDRONES_V1'
data_path = 'data/'!podaac-data-downloader -c $short_name -d $data_path$short_name --start-date $start_time --end-date $end_time/Users/crocha/miniconda3/lib/python3.9/site-packages/requests/__init__.py:102: RequestsDependencyWarning: urllib3 (1.26.8) or chardet (5.0.0)/charset_normalizer (2.0.4) doesn't match a supported version!
warnings.warn("urllib3 ({}) or chardet ({})/charset_normalizer ({}) doesn't match a supported "
[2022-11-28 19:19:40,724] {podaac_data_downloader.py:243} INFO - Found 10 total files to download
[2022-11-28 19:19:40,772] {podaac_data_downloader.py:268} INFO - 2022-11-28 19:19:40.772325 SKIPPED: https://archive.podaac.earthdata.nasa.gov/podaac-ops-cumulus-protected/SMODE_LX_SAILDRONES_V1/SMODE_PFC_saildrone_adcp_1074.nc
[2022-11-28 19:19:40,812] {podaac_data_downloader.py:268} INFO - 2022-11-28 19:19:40.812388 SKIPPED: https://archive.podaac.earthdata.nasa.gov/podaac-ops-cumulus-protected/SMODE_LX_SAILDRONES_V1/SMODE_PFC_saildrone_adcp_1075.nc
[2022-11-28 19:19:40,852] {podaac_data_downloader.py:268} INFO - 2022-11-28 19:19:40.852458 SKIPPED: https://archive.podaac.earthdata.nasa.gov/podaac-ops-cumulus-protected/SMODE_LX_SAILDRONES_V1/SMODE_PFC_saildrone_adcp_1062.nc
[2022-11-28 19:19:40,878] {podaac_data_downloader.py:268} INFO - 2022-11-28 19:19:40.878249 SKIPPED: https://archive.podaac.earthdata.nasa.gov/podaac-ops-cumulus-protected/SMODE_LX_SAILDRONES_V1/SMODE_PFC_saildrone_nonadcp_1062.nc
[2022-11-28 19:19:40,905] {podaac_data_downloader.py:268} INFO - 2022-11-28 19:19:40.905060 SKIPPED: https://archive.podaac.earthdata.nasa.gov/podaac-ops-cumulus-protected/SMODE_LX_SAILDRONES_V1/SMODE_PFC_saildrone_nonadcp_1074.nc
[2022-11-28 19:19:40,925] {podaac_data_downloader.py:268} INFO - 2022-11-28 19:19:40.925428 SKIPPED: https://archive.podaac.earthdata.nasa.gov/podaac-ops-cumulus-protected/SMODE_LX_SAILDRONES_V1/SMODE_PFC_saildrone_nonadcp_1075.nc
[2022-11-28 19:19:40,982] {podaac_data_downloader.py:268} INFO - 2022-11-28 19:19:40.982226 SKIPPED: https://archive.podaac.earthdata.nasa.gov/podaac-ops-cumulus-protected/SMODE_LX_SAILDRONES_V1/SMODE_PFC_saildrone_adcp_1072.nc
[2022-11-28 19:19:41,043] {podaac_data_downloader.py:268} INFO - 2022-11-28 19:19:41.043138 SKIPPED: https://archive.podaac.earthdata.nasa.gov/podaac-ops-cumulus-protected/SMODE_LX_SAILDRONES_V1/SMODE_PFC_saildrone_adcp_1073.nc
[2022-11-28 19:19:41,077] {podaac_data_downloader.py:268} INFO - 2022-11-28 19:19:41.077772 SKIPPED: https://archive.podaac.earthdata.nasa.gov/podaac-ops-cumulus-protected/SMODE_LX_SAILDRONES_V1/SMODE_PFC_saildrone_nonadcp_1072.nc
[2022-11-28 19:19:41,114] {podaac_data_downloader.py:268} INFO - 2022-11-28 19:19:41.114363 SKIPPED: https://archive.podaac.earthdata.nasa.gov/podaac-ops-cumulus-protected/SMODE_LX_SAILDRONES_V1/SMODE_PFC_saildrone_nonadcp_1073.nc
[2022-11-28 19:19:41,114] {podaac_data_downloader.py:287} INFO - Downloaded Files: 0
[2022-11-28 19:19:41,114] {podaac_data_downloader.py:288} INFO - Failed Files: 0
[2022-11-28 19:19:41,114] {podaac_data_downloader.py:289} INFO - Skipped Files: 10
[2022-11-28 19:19:41,375] {podaac_access.py:122} INFO - CMR token successfully deleted
[2022-11-28 19:19:41,375] {podaac_data_downloader.py:299} INFO - END
Non-ADCP data
Single saildrone
ds = xr.open_dataset(data_path + short_name + '/SMODE_PFC_saildrone_nonadcp_1073.nc').isel(trajectory=0)ds<xarray.Dataset>
Dimensions: (obs: 27360)
Coordinates:
latitude (obs) float64 37.08 37.08 ... 37.23 37.23
longitude (obs) float64 -125.0 -125.0 ... -123.6
time (obs) datetime64[ns] 2021-10-19 ... 2021-...
trajectory float32 1.073e+03
Dimensions without coordinates: obs
Data variables: (12/76)
SOG (obs) float64 0.453 0.468 ... 1.241 0.797
SOG_FILTERED_MEAN (obs) float64 0.532 0.428 ... nan 1.038
SOG_FILTERED_STDDEV (obs) float64 0.255 0.21 0.195 ... nan 0.295
SOG_FILTERED_MAX (obs) float64 1.222 0.938 ... nan 1.637
SOG_FILTERED_MIN (obs) float64 0.082 0.118 ... nan 0.449
COG (obs) float64 143.3 227.2 ... 72.8 92.9
... ...
BKSCT_RED_STDDEV (obs) float64 9e-06 1.1e-05 ... 2e-05
WATER_CURRENT_SPEED_MEAN (obs) float64 0.128 0.113 ... 0.25 0.251
WATER_CURRENT_DIRECTION_MEAN (obs) float64 110.4 110.6 ... 183.8 177.6
corrected_backscatter_at_650nm (obs) float64 0.0007284 0.00146 ... 0.001059
particulate_organic_carbon (obs) float64 9.836 22.48 ... 15.54 15.54
calibrated_chlorophyll (obs) float64 0.1204 0.1204 ... 0.5271
Attributes: (12/64)
title: S-MODE Pilot Campaign Fall 2021 Temperatur...
summary: 1min surface metereological and oceanograp...
ncei_template_version: NCEI_NetCDF_Trajectory_Template_v2.0
Conventions: CF-1.8, ACDD-1.3
netcdf_version: 4.6.3
featureType: trajectory
... ...
acknowledgement: We thank Paban Bhuyan (UConn) and Kim Spar...
time_coverage_start: 2021-10-19T00:00:00Z
time_coverage_end: 2021-11-06T23:59:00Z
geospatial_lon_min: -125.57976388888889
geospatial_lon_max: -122.39241944444444
id: SMODE_LX_SAILDRONES_V1xarray.Dataset
- obs: 27360
- latitude(obs)float64...
- standard_name :
- latitude
- long_name :
- Latitude
- units :
- degrees_north
- axis :
- Y
- installed_date :
- 2021-03-23T16:36:01.154876Z
- device_name :
- VectorNav Hull IMU (100037825)
- serial_number :
- 100037825
- installed_height :
- 0.34
- vendor_name :
- VectorNav
- model_name :
- VN-300
- model_product_page :
- https://www.vectornav.com/products/vn-300
- nominal_sampling_schedule :
- Always on
- update_period :
- 50.0
- coverage_content_type :
- coordinate
array([37.07879 , 37.078752, 37.07872 , ..., 37.22568 , 37.225875, 37.226026])
- longitude(obs)float64...
- standard_name :
- longitude
- long_name :
- Longitude
- units :
- degrees_east
- axis :
- X
- installed_date :
- 2021-03-23T16:36:01.154876Z
- device_name :
- VectorNav Hull IMU (100037825)
- serial_number :
- 100037825
- installed_height :
- 0.34
- vendor_name :
- VectorNav
- model_name :
- VN-300
- model_product_page :
- https://www.vectornav.com/products/vn-300
- nominal_sampling_schedule :
- Always on
- update_period :
- 50.0
- coverage_content_type :
- coordinate
array([-125.003302, -125.003392, -125.003469, ..., -123.642829, -123.642138, -123.641498]) - time(obs)datetime64[ns]...
- standard_name :
- time
- long_name :
- time in seconds
- axis :
- T
- coverage_content_type :
- coordinate
array(['2021-10-19T00:00:00.000000000', '2021-10-19T00:01:00.000000000', '2021-10-19T00:02:00.000000000', ..., '2021-11-06T23:57:00.000000000', '2021-11-06T23:58:00.000000000', '2021-11-06T23:59:00.000000000'], dtype='datetime64[ns]') - trajectory()float321.073e+03
- long_name :
- Trajectory/Drone ID
- cf_role :
- trajectory_id
- comment :
- A trajectory is a single deployment of a drone
- coverage_content_type :
- coordinate
array(1073., dtype=float32)
- SOG(obs)float64...
- standard_name :
- platform_speed_wrt_ground
- long_name :
- Speed over ground
- units :
- m s-1
- coverage_content_type :
- auxiliaryInformation
array([0.453, 0.468, 0.301, ..., 1.172, 1.241, 0.797])
- SOG_FILTERED_MEAN(obs)float64...
- standard_name :
- platform_speed_wrt_ground
- long_name :
- Speed over ground one minute mean
- units :
- m s-1
- coverage_content_type :
- auxiliaryInformation
array([0.532, 0.428, 0.385, ..., 1.144, nan, 1.038])
- SOG_FILTERED_STDDEV(obs)float64...
- standard_name :
- platform_speed_wrt_ground
- long_name :
- Speed over ground one minute stddev
- units :
- m s-1
- coverage_content_type :
- auxiliaryInformation
array([0.255, 0.21 , 0.195, ..., 0.269, nan, 0.295])
- SOG_FILTERED_MAX(obs)float64...
- standard_name :
- platform_speed_wrt_ground
- long_name :
- Speed over ground one minute max
- units :
- m s-1
- coverage_content_type :
- auxiliaryInformation
array([1.222, 0.938, 0.777, ..., 1.794, nan, 1.637])
- SOG_FILTERED_MIN(obs)float64...
- standard_name :
- platform_speed_wrt_ground
- long_name :
- Speed over ground one minute min
- units :
- m s-1
- coverage_content_type :
- auxiliaryInformation
array([0.082, 0.118, 0.021, ..., 0.62 , nan, 0.449])
- COG(obs)float64...
- standard_name :
- platform_course
- long_name :
- Course over ground
- units :
- degree
- coverage_content_type :
- auxiliaryInformation
- remark :
- 0 degrees is north, 90 degrees is east, etc.
array([143.3, 227.2, 171.3, ..., 88.3, 72.8, 92.9])
- COG_FILTERED_MEAN(obs)float64...
- standard_name :
- platform_course
- long_name :
- Course over ground one minute mean
- units :
- degree
- coverage_content_type :
- auxiliaryInformation
- remark :
- 0 degrees is north, 90 degrees is east, etc.
array([155.2, 138.4, 27.4, ..., 68.6, nan, 74.1])
- COG_FILTERED_STDDEV(obs)float64...
- standard_name :
- platform_course
- long_name :
- Course over ground one minute stddev
- units :
- degree
- coverage_content_type :
- auxiliaryInformation
- remark :
- 0 degrees is north, 90 degrees is east, etc.
array([213.9, 286.1, 178.1, ..., 17.6, nan, 16.8])
- HDG(obs)float64...
- standard_name :
- platform_yaw_angle
- long_name :
- Vehicle heading
- units :
- degree
- coverage_content_type :
- auxiliaryInformation
- remark :
- 0 degrees is north, 90 degrees is east, etc.
array([277. , 274.3, 274.5, ..., 56.9, 64.4, 56.7])
- HDG_FILTERED_MEAN(obs)float64...
- standard_name :
- platform_yaw_angle
- long_name :
- Vehicle heading one minute mean
- units :
- degree
- coverage_content_type :
- auxiliaryInformation
- remark :
- 0 degrees is north, 90 degrees is east, etc.
array([273.6, 277.5, 279.2, ..., 55.4, nan, 59.3])
- HDG_FILTERED_STDDEV(obs)float64...
- standard_name :
- platform_yaw_angle
- long_name :
- Vehicle heading one minute stddev
- units :
- degree
- coverage_content_type :
- auxiliaryInformation
- remark :
- 0 degrees is north, 90 degrees is east, etc.
array([3.2, 3.5, 3. , ..., 3.6, nan, 2.9])
- ROLL_FILTERED_MEAN(obs)float64...
- standard_name :
- platform_roll_angle
- long_name :
- Vehicle roll one minute mean
- units :
- degree
- coverage_content_type :
- auxiliaryInformation
- remark :
- 0 degrees is vertical, positive is counterclockwise, etc.
array([-0.8, -0.7, -1. , ..., 3.2, nan, 2.5])
- ROLL_FILTERED_STDDEV(obs)float64...
- standard_name :
- platform_roll_angle
- long_name :
- Vehicle roll one minute stddev
- units :
- degree
- coverage_content_type :
- auxiliaryInformation
- remark :
- 0 degrees is vertical, positive is counterclockwise, etc.
array([7.8, 6.2, 7.1, ..., 5.6, nan, 5.7])
- ROLL_FILTERED_PEAK(obs)float64...
- standard_name :
- platform_roll_angle
- long_name :
- Vehicle roll one minute peak
- units :
- degree
- coverage_content_type :
- auxiliaryInformation
- remark :
- 0 degrees is vertical, positive is counterclockwise, etc.
array([-17.4, -15.9, -17.3, ..., 13.8, nan, 16.6])
- PITCH_FILTERED_MEAN(obs)float64...
- standard_name :
- platform_pitch_angle
- long_name :
- Vehicle pitch one minute mean
- units :
- degree
- coverage_content_type :
- auxiliaryInformation
- remark :
- 0 degrees is vertical, positive is counterclockwise, etc.
array([ 0.2, 0. , 0.1, ..., -0.1, nan, -0.1])
- PITCH_FILTERED_STDDEV(obs)float64...
- standard_name :
- platform_pitch_angle
- long_name :
- Vehicle pitch one minute stddev
- units :
- degree
- coverage_content_type :
- auxiliaryInformation
- remark :
- 0 degrees is vertical, positive is counterclockwise, etc.
array([2.5, 2.1, 2. , ..., 2.4, nan, 2.8])
- PITCH_FILTERED_PEAK(obs)float64...
- standard_name :
- platform_pitch_angle
- long_name :
- Vehicle pitch one minute peak
- units :
- degree
- coverage_content_type :
- auxiliaryInformation
- remark :
- 0 degrees is vertical, positive is counterclockwise, etc.
array([ 5.3, -5.8, 4.2, ..., 6.4, nan, 6.9])
- HDG_WING(obs)float64...
- long_name :
- Wing heading
- units :
- degree
- coverage_content_type :
- auxiliaryInformation
- remark :
- 0 degrees is north, 90 degrees is east, etc.
array([351.8, 341.4, 335.5, ..., 4.8, 359.3, 359.6])
- WING_HDG_FILTERED_MEAN(obs)float64...
- long_name :
- Wing heading one minute mean
- units :
- degree
- coverage_content_type :
- auxiliaryInformation
- remark :
- 0 degrees is north, 90 degrees is east, etc.
array([344.7, 339.9, 345.1, ..., 4. , nan, 4.3])
- WING_HDG_FILTERED_STDDEV(obs)float64...
- long_name :
- Wing heading one minute stddev
- units :
- degree
- coverage_content_type :
- auxiliaryInformation
- remark :
- 0 degrees is north, 90 degrees is east, etc.
array([7. , 5.1, 6.3, ..., 4.2, nan, 4.3])
- WING_ROLL_FILTERED_MEAN(obs)float64...
- long_name :
- Wing roll one minute mean
- units :
- degree
- coverage_content_type :
- auxiliaryInformation
- remark :
- 0 degrees is vertical, positive is counterclockwise, etc.
array([-1.3, -1.5, -1.4, ..., 0.4, nan, -0.2])
- WING_ROLL_FILTERED_STDDEV(obs)float64...
- long_name :
- Wing roll one minute stddev
- units :
- degree
- coverage_content_type :
- auxiliaryInformation
- remark :
- 0 degrees is vertical, positive is counterclockwise, etc.
array([3.1, 3. , 3. , ..., 4.4, nan, 3.7])
- WING_ROLL_FILTERED_PEAK(obs)float64...
- long_name :
- Wing roll one minute peak
- units :
- degree
- coverage_content_type :
- auxiliaryInformation
- remark :
- 0 degrees is vertical, positive is counterclockwise, etc.
array([nan, nan, nan, ..., nan, nan, nan])
- WING_PITCH_FILTERED_MEAN(obs)float64...
- long_name :
- Wing pitch one minute mean
- units :
- degree
- coverage_content_type :
- auxiliaryInformation
- remark :
- 0 degrees is vertical, positive is counterclockwise, etc.
array([0.5, 0.4, 0.6, ..., 2.9, nan, 2.5])
- WING_PITCH_FILTERED_STDDEV(obs)float64...
- long_name :
- Wing pitch one minute stddev
- units :
- degree
- coverage_content_type :
- auxiliaryInformation
- remark :
- 0 degrees is vertical, positive is counterclockwise, etc.
array([7.6, 5.8, 6.8, ..., 4.4, nan, 5.2])
- WING_PITCH_FILTERED_PEAK(obs)float64...
- long_name :
- Wing pitch one minute peak
- units :
- degree
- coverage_content_type :
- auxiliaryInformation
- remark :
- 0 degrees is vertical, positive is counterclockwise, etc.
array([-15.8, 13.4, 16.6, ..., 9.8, nan, 14.4])
- WING_ANGLE(obs)float64...
- long_name :
- Wing angle
- units :
- degree
- coverage_content_type :
- auxiliaryInformation
- remark :
- 0 degrees is vertical, positive is counterclockwise, etc.
array([ 73.9, 67. , 61.1, ..., -52.3, -65.8, -57.3])
- WIND_FROM_MEAN(obs)float64...
- standard_name :
- wind_from_direction
- long_name :
- Wind from
- units :
- degree
- installed_date :
- 2021-08-19T03:32:23.396236Z
- device_name :
- Gill Anemometer (W182723)
- serial_number :
- W182723
- last_calibrated :
- 2018-07-23
- installed_height :
- 5.2
- firmware :
- 2329-701-01
- vendor_name :
- Gill
- model_name :
- 1590-PK-020
- model_product_page :
- http://gillinstruments.com/products/anemometer/windmaster.htm
- nominal_sampling_schedule :
- 60s on, 240s off, centered at :00
- update_period :
- 50.0
- coverage_content_type :
- physicalMeasurement
- remark :
- 0 degrees is north, 90 degrees is east, etc.
array([345.3, 350.3, 336.5, ..., 344. , 343.9, 345.3])
- WIND_FROM_STDDEV(obs)float64...
- long_name :
- Wind from SD
- units :
- degree
- installed_date :
- 2021-08-19T03:32:23.396236Z
- device_name :
- Gill Anemometer (W182723)
- serial_number :
- W182723
- last_calibrated :
- 2018-07-23
- installed_height :
- 5.2
- firmware :
- 2329-701-01
- vendor_name :
- Gill
- model_name :
- 1590-PK-020
- model_product_page :
- http://gillinstruments.com/products/anemometer/windmaster.htm
- nominal_sampling_schedule :
- 60s on, 240s off, centered at :00
- update_period :
- 50.0
- coverage_content_type :
- physicalMeasurement
- remark :
- 0 degrees is north, 90 degrees is east, etc.
array([nan, nan, nan, ..., nan, nan, nan])
- WIND_SPEED_MEAN(obs)float64...
- standard_name :
- wind_speed
- long_name :
- Wind speed
- units :
- m s-1
- installed_date :
- 2021-08-19T03:32:23.396236Z
- device_name :
- Gill Anemometer (W182723)
- serial_number :
- W182723
- last_calibrated :
- 2018-07-23
- installed_height :
- 5.2
- firmware :
- 2329-701-01
- vendor_name :
- Gill
- model_name :
- 1590-PK-020
- model_product_page :
- http://gillinstruments.com/products/anemometer/windmaster.htm
- nominal_sampling_schedule :
- 60s on, 240s off, centered at :00
- update_period :
- 50.0
- coverage_content_type :
- physicalMeasurement
array([2.25, 2.32, 2.41, ..., 6.15, 6.24, 6.48])
- WIND_SPEED_STDDEV(obs)float64...
- long_name :
- Wind speed SD
- units :
- m s-1
- installed_date :
- 2021-08-19T03:32:23.396236Z
- device_name :
- Gill Anemometer (W182723)
- serial_number :
- W182723
- last_calibrated :
- 2018-07-23
- installed_height :
- 5.2
- firmware :
- 2329-701-01
- vendor_name :
- Gill
- model_name :
- 1590-PK-020
- model_product_page :
- http://gillinstruments.com/products/anemometer/windmaster.htm
- nominal_sampling_schedule :
- 60s on, 240s off, centered at :00
- update_period :
- 50.0
- coverage_content_type :
- physicalMeasurement
array([nan, nan, nan, ..., nan, nan, nan])
- UWND_MEAN(obs)float64...
- standard_name :
- eastward_wind
- long_name :
- Eastward wind speed
- units :
- m s-1
- installed_date :
- 2021-08-19T03:32:23.396236Z
- device_name :
- Gill Anemometer (W182723)
- serial_number :
- W182723
- last_calibrated :
- 2018-07-23
- installed_height :
- 5.2
- firmware :
- 2329-701-01
- vendor_name :
- Gill
- model_name :
- 1590-PK-020
- model_product_page :
- http://gillinstruments.com/products/anemometer/windmaster.htm
- nominal_sampling_schedule :
- 60s on, 240s off, centered at :00
- update_period :
- 50.0
- coverage_content_type :
- physicalMeasurement
array([0.57, 0.39, 0.96, ..., 1.7 , 1.73, 1.65])
- UWND_STDDEV(obs)float64...
- long_name :
- Eastward wind speed SD
- units :
- m s-1
- installed_date :
- 2021-08-19T03:32:23.396236Z
- device_name :
- Gill Anemometer (W182723)
- serial_number :
- W182723
- last_calibrated :
- 2018-07-23
- installed_height :
- 5.2
- firmware :
- 2329-701-01
- vendor_name :
- Gill
- model_name :
- 1590-PK-020
- model_product_page :
- http://gillinstruments.com/products/anemometer/windmaster.htm
- nominal_sampling_schedule :
- 60s on, 240s off, centered at :00
- update_period :
- 50.0
- coverage_content_type :
- physicalMeasurement
array([0.34, 0.33, 0.26, ..., 0.49, 0.38, 0.45])
- VWND_MEAN(obs)float64...
- standard_name :
- northward_wind
- long_name :
- Northward wind speed
- units :
- m s-1
- installed_date :
- 2021-08-19T03:32:23.396236Z
- device_name :
- Gill Anemometer (W182723)
- serial_number :
- W182723
- last_calibrated :
- 2018-07-23
- installed_height :
- 5.2
- firmware :
- 2329-701-01
- vendor_name :
- Gill
- model_name :
- 1590-PK-020
- model_product_page :
- http://gillinstruments.com/products/anemometer/windmaster.htm
- nominal_sampling_schedule :
- 60s on, 240s off, centered at :00
- update_period :
- 50.0
- coverage_content_type :
- physicalMeasurement
array([-2.18, -2.29, -2.21, ..., -5.91, -6. , -6.27])
- VWND_STDDEV(obs)float64...
- long_name :
- Northward wind speed SD
- units :
- m s-1
- installed_date :
- 2021-08-19T03:32:23.396236Z
- device_name :
- Gill Anemometer (W182723)
- serial_number :
- W182723
- last_calibrated :
- 2018-07-23
- installed_height :
- 5.2
- firmware :
- 2329-701-01
- vendor_name :
- Gill
- model_name :
- 1590-PK-020
- model_product_page :
- http://gillinstruments.com/products/anemometer/windmaster.htm
- nominal_sampling_schedule :
- 60s on, 240s off, centered at :00
- update_period :
- 50.0
- coverage_content_type :
- physicalMeasurement
array([0.25, 0.26, 0.24, ..., 0.49, 0.54, 0.58])
- WWND_MEAN(obs)float64...
- standard_name :
- downward_air_velocity
- long_name :
- Downward wind speed
- units :
- m s-1
- installed_date :
- 2021-08-19T03:32:23.396236Z
- device_name :
- Gill Anemometer (W182723)
- serial_number :
- W182723
- last_calibrated :
- 2018-07-23
- installed_height :
- 5.2
- firmware :
- 2329-701-01
- vendor_name :
- Gill
- model_name :
- 1590-PK-020
- model_product_page :
- http://gillinstruments.com/products/anemometer/windmaster.htm
- nominal_sampling_schedule :
- 60s on, 240s off, centered at :00
- update_period :
- 50.0
- coverage_content_type :
- physicalMeasurement
array([-0.09, -0.07, -0.15, ..., -0.22, -0.13, -0.17])
- WWND_STDDEV(obs)float64...
- long_name :
- Downward wind speed SD
- units :
- m s-1
- installed_date :
- 2021-08-19T03:32:23.396236Z
- device_name :
- Gill Anemometer (W182723)
- serial_number :
- W182723
- last_calibrated :
- 2018-07-23
- installed_height :
- 5.2
- firmware :
- 2329-701-01
- vendor_name :
- Gill
- model_name :
- 1590-PK-020
- model_product_page :
- http://gillinstruments.com/products/anemometer/windmaster.htm
- nominal_sampling_schedule :
- 60s on, 240s off, centered at :00
- update_period :
- 50.0
- coverage_content_type :
- physicalMeasurement
array([0.33, 0.32, 0.24, ..., 0.36, 0.3 , 0.29])
- GUST_WND_MEAN(obs)float64...
- standard_name :
- wind_speed_of_gust
- long_name :
- Wind gust speed
- units :
- m s-1
- installed_date :
- 2021-08-19T03:32:23.396236Z
- device_name :
- Gill Anemometer (W182723)
- serial_number :
- W182723
- last_calibrated :
- 2018-07-23
- installed_height :
- 5.2
- firmware :
- 2329-701-01
- vendor_name :
- Gill
- model_name :
- 1590-PK-020
- model_product_page :
- http://gillinstruments.com/products/anemometer/windmaster.htm
- nominal_sampling_schedule :
- 60s on, 240s off, centered at :00
- update_period :
- 50.0
- coverage_content_type :
- physicalMeasurement
array([3.05, 2.83, 2.91, ..., 7.02, 6.89, 7.59])
- GUST_WND_STDDEV(obs)float64...
- long_name :
- Wind gust speed SD
- units :
- m s-1
- installed_date :
- 2021-08-19T03:32:23.396236Z
- device_name :
- Gill Anemometer (W182723)
- serial_number :
- W182723
- last_calibrated :
- 2018-07-23
- installed_height :
- 5.2
- firmware :
- 2329-701-01
- vendor_name :
- Gill
- model_name :
- 1590-PK-020
- model_product_page :
- http://gillinstruments.com/products/anemometer/windmaster.htm
- nominal_sampling_schedule :
- 60s on, 240s off, centered at :00
- update_period :
- 50.0
- coverage_content_type :
- physicalMeasurement
array([0.26, 0.22, 0.21, ..., 0.37, 0.44, 0.49])
- WIND_MEASUREMENT_HEIGHT_MEAN(obs)float64...
- long_name :
- Wind measurement height
- units :
- m
- installed_date :
- 2021-08-19T03:32:23.396236Z
- device_name :
- Gill Anemometer (W182723)
- serial_number :
- W182723
- last_calibrated :
- 2018-07-23
- installed_height :
- 5.2
- firmware :
- 2329-701-01
- vendor_name :
- Gill
- model_name :
- 1590-PK-020
- model_product_page :
- http://gillinstruments.com/products/anemometer/windmaster.htm
- nominal_sampling_schedule :
- 60s on, 240s off, centered at :00
- update_period :
- 50.0
- coverage_content_type :
- physicalMeasurement
array([4.952, 4.955, 4.965, ..., 4.97 , 4.971, 4.953])
- WIND_MEASUREMENT_HEIGHT_STDDEV(obs)float64...
- long_name :
- Wind measurement height SD
- units :
- m
- installed_date :
- 2021-08-19T03:32:23.396236Z
- device_name :
- Gill Anemometer (W182723)
- serial_number :
- W182723
- last_calibrated :
- 2018-07-23
- installed_height :
- 5.2
- firmware :
- 2329-701-01
- vendor_name :
- Gill
- model_name :
- 1590-PK-020
- model_product_page :
- http://gillinstruments.com/products/anemometer/windmaster.htm
- nominal_sampling_schedule :
- 60s on, 240s off, centered at :00
- update_period :
- 50.0
- coverage_content_type :
- physicalMeasurement
array([0.051, 0.055, 0.034, ..., 0.031, 0.033, 0.062])
- TEMP_AIR_MEAN(obs)float64...
- standard_name :
- air_temperature
- long_name :
- Air temperature
- units :
- degrees_c
- installed_date :
- 2021-09-24T16:50:39.887551Z
- device_name :
- Rotronic AT/RH (0020262335)
- serial_number :
- 0020262335
- installed_height :
- 2.3
- firmware :
- V1.2-1
- vendor_name :
- Rotronic
- model_name :
- HC2-S3
- nominal_sampling_schedule :
- 60s on, 240s off, centered at :00
- update_period :
- 1000.0
- coverage_content_type :
- physicalMeasurement
array([14.44, 14.44, 14.46, ..., 14.42, 14.39, 14.4 ])
- TEMP_AIR_STDDEV(obs)float64...
- long_name :
- Air temperature SD
- units :
- degrees_c
- installed_date :
- 2021-09-24T16:50:39.887551Z
- device_name :
- Rotronic AT/RH (0020262335)
- serial_number :
- 0020262335
- installed_height :
- 2.3
- firmware :
- V1.2-1
- vendor_name :
- Rotronic
- model_name :
- HC2-S3
- nominal_sampling_schedule :
- 60s on, 240s off, centered at :00
- update_period :
- 1000.0
- coverage_content_type :
- physicalMeasurement
array([0.02, 0.01, 0.02, ..., 0.01, 0.01, 0.01])
- RH_MEAN(obs)float64...
- standard_name :
- relative_humidity
- long_name :
- Relative humidity
- units :
- percent
- installed_date :
- 2021-09-24T16:50:39.887551Z
- device_name :
- Rotronic AT/RH (0020262335)
- serial_number :
- 0020262335
- installed_height :
- 2.3
- firmware :
- V1.2-1
- vendor_name :
- Rotronic
- model_name :
- HC2-S3
- nominal_sampling_schedule :
- 60s on, 240s off, centered at :00
- update_period :
- 1000.0
- coverage_content_type :
- physicalMeasurement
array([67.89, 69.03, 69.43, ..., 85.26, 84.69, 85.46])
- RH_STDDEV(obs)float64...
- long_name :
- Relative humidity SD
- units :
- percent
- installed_date :
- 2021-09-24T16:50:39.887551Z
- device_name :
- Rotronic AT/RH (0020262335)
- serial_number :
- 0020262335
- installed_height :
- 2.3
- firmware :
- V1.2-1
- vendor_name :
- Rotronic
- model_name :
- HC2-S3
- nominal_sampling_schedule :
- 60s on, 240s off, centered at :00
- update_period :
- 1000.0
- coverage_content_type :
- physicalMeasurement
array([0.46, 0.78, 1.38, ..., 0.21, 0.34, 0.49])
- BARO_PRES_MEAN(obs)float64...
- standard_name :
- air_pressure
- long_name :
- Air pressure
- units :
- hPa
- installed_date :
- 2021-10-13T00:45:44.607256Z
- device_name :
- Vaisala Barometer (3910334)
- serial_number :
- 3910334
- last_calibrated :
- 2018-09-24
- installed_height :
- 0.2
- firmware :
- 2.0
- vendor_name :
- Vaisala
- model_name :
- PTB210
- model_product_page :
- http://www.vaisala.com/en/products/pressure/Pages/PTB210.aspx
- nominal_sampling_schedule :
- 60s on, 240s off, centered at :00
- update_period :
- 1000.0
- coverage_content_type :
- physicalMeasurement
array([1018.05, 1018.03, 1018.02, ..., 1021.75, 1021.74, 1021.74])
- BARO_PRES_STDDEV(obs)float64...
- long_name :
- Air pressure SD
- units :
- hPa
- installed_date :
- 2021-10-13T00:45:44.607256Z
- device_name :
- Vaisala Barometer (3910334)
- serial_number :
- 3910334
- last_calibrated :
- 2018-09-24
- installed_height :
- 0.2
- firmware :
- 2.0
- vendor_name :
- Vaisala
- model_name :
- PTB210
- model_product_page :
- http://www.vaisala.com/en/products/pressure/Pages/PTB210.aspx
- nominal_sampling_schedule :
- 60s on, 240s off, centered at :00
- update_period :
- 1000.0
- coverage_content_type :
- physicalMeasurement
array([0.18, 0.13, 0.09, ..., 0.05, 0.06, 0.05])
- PAR_AIR_MEAN(obs)float64...
- standard_name :
- surface_downwelling_photosynthetic_photon_flux_in_air
- long_name :
- Photosynthetically active radiation in air
- units :
- micromol s-1 m-2
- installed_date :
- 2021-09-24T16:50:28.823747Z
- device_name :
- LI-COR PAR (UWQ9641)
- serial_number :
- UWQ9641
- last_calibrated :
- 2018-01-27
- installed_height :
- 2.6
- vendor_name :
- LI-COR
- model_name :
- LI-192SA
- model_product_page :
- https://www.licor.com/env/products/light/quantum_underwater.html
- nominal_sampling_schedule :
- Always on
- update_period :
- 1000.0
- coverage_content_type :
- physicalMeasurement
array([634., 629., 609., ..., 130., 128., 127.])
- PAR_AIR_STDDEV(obs)float64...
- long_name :
- Photosynthetically active radiation in air SD
- units :
- micromol s-1 m-2
- installed_date :
- 2021-09-24T16:50:28.823747Z
- device_name :
- LI-COR PAR (UWQ9641)
- serial_number :
- UWQ9641
- last_calibrated :
- 2018-01-27
- installed_height :
- 2.6
- vendor_name :
- LI-COR
- model_name :
- LI-192SA
- model_product_page :
- https://www.licor.com/env/products/light/quantum_underwater.html
- nominal_sampling_schedule :
- Always on
- update_period :
- 1000.0
- coverage_content_type :
- physicalMeasurement
array([123., 125., 85., ..., 2., 2., 2.])
- TEMP_IR_SEA_WING_UNCOMP_MEAN(obs)float64...
- standard_name :
- sea_surface_skin_temperature
- long_name :
- Wing Sea IR Temperature
- units :
- degrees_c
- installed_date :
- 2021-09-24T16:50:08.744103Z
- device_name :
- Heitronics Wing IR Pyrometer (12596)
- serial_number :
- 12596
- last_calibrated :
- 2018-03-12
- installed_height :
- 2.3
- firmware :
- 5.07
- vendor_name :
- Heitronics
- model_name :
- CT15.10
- nominal_sampling_schedule :
- 30s on, 270s off, centered at :00
- update_period :
- 1000.0
- coverage_content_type :
- physicalMeasurement
array([14.42, 14.51, 14.5 , ..., 14.31, 14.3 , 14.26])
- TEMP_IR_SEA_WING_UNCOMP_STDDEV(obs)float64...
- long_name :
- Wing Sea IR Temperature SD
- units :
- degrees_c
- installed_date :
- 2021-09-24T16:50:08.744103Z
- device_name :
- Heitronics Wing IR Pyrometer (12596)
- serial_number :
- 12596
- last_calibrated :
- 2018-03-12
- installed_height :
- 2.3
- firmware :
- 5.07
- vendor_name :
- Heitronics
- model_name :
- CT15.10
- nominal_sampling_schedule :
- 30s on, 270s off, centered at :00
- update_period :
- 1000.0
- coverage_content_type :
- physicalMeasurement
array([0.03, 0.04, 0.03, ..., 0.01, 0.02, 0.01])
- WAVE_DOMINANT_PERIOD(obs)float64...
- standard_name :
- sea_surface_wave_period_at_variance_spectral_density_maximum
- long_name :
- Dominant wave period
- units :
- s
- installed_date :
- 2021-03-23T16:36:01.154876Z
- device_name :
- VectorNav Hull IMU (100037825)
- serial_number :
- 100037825
- installed_height :
- 0.34
- firmware :
- 0.5.0.2
- vendor_name :
- VectorNav
- model_name :
- VN-300
- model_product_page :
- https://www.vectornav.com/products/vn-300
- nominal_sampling_schedule :
- Always on
- update_period :
- 50.0
- coverage_content_type :
- physicalMeasurement
array([11.64, nan, nan, ..., nan, nan, nan])
- WAVE_SIGNIFICANT_HEIGHT(obs)float64...
- standard_name :
- sea_surface_wave_significant_height
- long_name :
- Significant wave height
- units :
- m
- installed_date :
- 2021-03-23T16:36:01.154876Z
- device_name :
- VectorNav Hull IMU (100037825)
- serial_number :
- 100037825
- installed_height :
- 0.34
- firmware :
- 0.5.0.2
- vendor_name :
- VectorNav
- model_name :
- VN-300
- model_product_page :
- https://www.vectornav.com/products/vn-300
- nominal_sampling_schedule :
- Always on
- update_period :
- 50.0
- coverage_content_type :
- physicalMeasurement
array([2.909, nan, nan, ..., nan, nan, nan])
- TEMP_DEPTH_HALFMETER_MEAN(obs)float64...
- standard_name :
- sea_water_temperature
- long_name :
- Seawater temperature at depth of 0.5m
- units :
- degrees_c
- installed_date :
- 2021-10-13T15:00:27.768150Z
- device_name :
- RBR Temperature Logger (205776)
- serial_number :
- 205776
- last_calibrated :
- 2021-09-13
- installed_height :
- -0.5
- firmware :
- 105
- vendor_name :
- RBR
- model_name :
- Coda^3 T
- coverage_content_type :
- physicalMeasurement
array([15.307, 15.32 , 15.324, ..., 14.521, 14.509, 14.471])
- TEMP_DEPTH_HALFMETER_STDDEV(obs)float64...
- long_name :
- Seawater temperature at depth of 0.5m SD
- units :
- degrees_c
- installed_date :
- 2021-10-13T15:00:27.768150Z
- device_name :
- RBR Temperature Logger (205776)
- serial_number :
- 205776
- last_calibrated :
- 2021-09-13
- installed_height :
- -0.5
- firmware :
- 105
- vendor_name :
- RBR
- model_name :
- Coda^3 T
- coverage_content_type :
- physicalMeasurement
array([0.012, 0.01 , 0.009, ..., 0.01 , 0.011, 0.01 ])
- TEMP_SBE37_MEAN(obs)float64...
- standard_name :
- sea_water_temperature
- long_name :
- Seawater temperature
- units :
- degrees_c
- installed_date :
- 2021-10-04T22:23:51.226962Z
- device_name :
- Sea-Bird Scientific Conductivity/Temp/ODO (20848)
- serial_number :
- 20848
- last_calibrated :
- 2021-09-12
- installed_height :
- -0.5
- firmware :
- v6.0.3
- vendor_name :
- Sea-Bird Scientific
- model_name :
- SBE37-SMP-ODO Microcat
- nominal_sampling_schedule :
- 12s on, 588s off, centered at :00
- update_period :
- 1000.0
- coverage_content_type :
- physicalMeasurement
array([15.3207, 15.3324, 15.3444, ..., nan, nan, nan])
- TEMP_SBE37_STDDEV(obs)float64...
- long_name :
- Seawater temperature SD
- units :
- degrees_c
- installed_date :
- 2021-10-04T22:23:51.226962Z
- device_name :
- Sea-Bird Scientific Conductivity/Temp/ODO (20848)
- serial_number :
- 20848
- last_calibrated :
- 2021-09-12
- installed_height :
- -0.5
- firmware :
- v6.0.3
- vendor_name :
- Sea-Bird Scientific
- model_name :
- SBE37-SMP-ODO Microcat
- nominal_sampling_schedule :
- 12s on, 588s off, centered at :00
- update_period :
- 1000.0
- coverage_content_type :
- physicalMeasurement
array([0.0018, 0.0033, 0.0038, ..., nan, nan, nan])
- SAL_SBE37_MEAN(obs)float64...
- standard_name :
- sea_water_practical_salinity
- long_name :
- Seawater salinity
- units :
- 1
- installed_date :
- 2021-10-04T22:23:51.226962Z
- device_name :
- Sea-Bird Scientific Conductivity/Temp/ODO (20848)
- serial_number :
- 20848
- last_calibrated :
- 2021-09-12
- installed_height :
- -0.5
- firmware :
- v6.0.3
- vendor_name :
- Sea-Bird Scientific
- model_name :
- SBE37-SMP-ODO Microcat
- nominal_sampling_schedule :
- 12s on, 588s off, centered at :00
- update_period :
- 1000.0
- coverage_content_type :
- physicalMeasurement
array([33.3813, 33.3818, 33.3821, ..., nan, nan, nan])
- SAL_SBE37_STDDEV(obs)float64...
- long_name :
- Seawater salinity SD
- units :
- 1
- installed_date :
- 2021-10-04T22:23:51.226962Z
- device_name :
- Sea-Bird Scientific Conductivity/Temp/ODO (20848)
- serial_number :
- 20848
- last_calibrated :
- 2021-09-12
- installed_height :
- -0.5
- firmware :
- v6.0.3
- vendor_name :
- Sea-Bird Scientific
- model_name :
- SBE37-SMP-ODO Microcat
- nominal_sampling_schedule :
- 12s on, 588s off, centered at :00
- update_period :
- 1000.0
- coverage_content_type :
- physicalMeasurement
array([0.0007, 0.0007, 0.0005, ..., nan, nan, nan])
- COND_SBE37_MEAN(obs)float64...
- standard_name :
- sea_water_electrical_conductivity
- long_name :
- Seawater conductivity
- units :
- mS cm-1
- installed_date :
- 2021-10-04T22:23:51.226962Z
- device_name :
- Sea-Bird Scientific Conductivity/Temp/ODO (20848)
- serial_number :
- 20848
- last_calibrated :
- 2021-09-12
- installed_height :
- -0.5
- firmware :
- v6.0.3
- vendor_name :
- Sea-Bird Scientific
- model_name :
- SBE37-SMP-ODO Microcat
- nominal_sampling_schedule :
- 12s on, 588s off, centered at :00
- update_period :
- 1000.0
- coverage_content_type :
- physicalMeasurement
array([41.45736, 41.46904, 41.48072, ..., nan, nan, nan])
- COND_SBE37_STDDEV(obs)float64...
- long_name :
- Seawater conductivity SD
- units :
- mS cm-1
- installed_date :
- 2021-10-04T22:23:51.226962Z
- device_name :
- Sea-Bird Scientific Conductivity/Temp/ODO (20848)
- serial_number :
- 20848
- last_calibrated :
- 2021-09-12
- installed_height :
- -0.5
- firmware :
- v6.0.3
- vendor_name :
- Sea-Bird Scientific
- model_name :
- SBE37-SMP-ODO Microcat
- nominal_sampling_schedule :
- 12s on, 588s off, centered at :00
- update_period :
- 1000.0
- coverage_content_type :
- physicalMeasurement
array([0.00176, 0.00323, 0.00352, ..., nan, nan, nan])
- O2_CONC_SBE37_MEAN(obs)float64...
- standard_name :
- mole_concentration_of_dissolved_molecular_oxygen_in_sea_water
- long_name :
- Oxygen concentration
- units :
- micromol L-1
- installed_date :
- 2021-10-04T22:23:51.226962Z
- device_name :
- Sea-Bird Scientific Conductivity/Temp/ODO (20848)
- serial_number :
- 20848
- last_calibrated :
- 2021-09-12
- installed_height :
- -0.5
- firmware :
- v6.0.3
- vendor_name :
- Sea-Bird Scientific
- model_name :
- SBE37-SMP-ODO Microcat
- nominal_sampling_schedule :
- 12s on, 588s off, centered at :00
- update_period :
- 1000.0
- coverage_content_type :
- physicalMeasurement
array([254.79, 254.71, 254.56, ..., nan, nan, nan])
- O2_CONC_SBE37_STDDEV(obs)float64...
- long_name :
- Oxygen concentration SD
- units :
- micromol L-1
- installed_date :
- 2021-10-04T22:23:51.226962Z
- device_name :
- Sea-Bird Scientific Conductivity/Temp/ODO (20848)
- serial_number :
- 20848
- last_calibrated :
- 2021-09-12
- installed_height :
- -0.5
- firmware :
- v6.0.3
- vendor_name :
- Sea-Bird Scientific
- model_name :
- SBE37-SMP-ODO Microcat
- nominal_sampling_schedule :
- 12s on, 588s off, centered at :00
- update_period :
- 1000.0
- coverage_content_type :
- physicalMeasurement
array([0.23, 0.21, 0. , ..., nan, nan, nan])
- O2_SAT_SBE37_MEAN(obs)float64...
- standard_name :
- fractional_saturation_of_oxygen_in_sea_water
- long_name :
- Oxygen saturation
- units :
- percent
- installed_date :
- 2021-10-04T22:23:51.226962Z
- device_name :
- Sea-Bird Scientific Conductivity/Temp/ODO (20848)
- serial_number :
- 20848
- last_calibrated :
- 2021-09-12
- installed_height :
- -0.5
- firmware :
- v6.0.3
- vendor_name :
- Sea-Bird Scientific
- model_name :
- SBE37-SMP-ODO Microcat
- nominal_sampling_schedule :
- 12s on, 588s off, centered at :00
- update_period :
- 1000.0
- coverage_content_type :
- physicalMeasurement
array([99.86, 99.86, 99.82, ..., nan, nan, nan])
- O2_SAT_SBE37_STDDEV(obs)float64...
- long_name :
- Oxygen saturation SD
- units :
- percent
- installed_date :
- 2021-10-04T22:23:51.226962Z
- device_name :
- Sea-Bird Scientific Conductivity/Temp/ODO (20848)
- serial_number :
- 20848
- last_calibrated :
- 2021-09-12
- installed_height :
- -0.5
- firmware :
- v6.0.3
- vendor_name :
- Sea-Bird Scientific
- model_name :
- SBE37-SMP-ODO Microcat
- nominal_sampling_schedule :
- 12s on, 588s off, centered at :00
- update_period :
- 1000.0
- coverage_content_type :
- physicalMeasurement
array([0.09, 0.08, 0.01, ..., nan, nan, nan])
- CHLOR_WETLABS_MEAN(obs)float64...
- standard_name :
- mass_concentration_of_chlorophyll_in_sea_water
- long_name :
- Chlorophyll concentration
- units :
- microgram L-1
- installed_date :
- 2021-10-04T22:23:56.294399Z
- device_name :
- WET Labs Fluorometer (1503)
- serial_number :
- 1503
- last_calibrated :
- 2016-10-25
- installed_height :
- -0.25
- firmware :
- Triplet5.33
- vendor_name :
- WET Labs
- model_name :
- BBFL2W
- model_product_page :
- http://wetlabs.com/eco-triplet-w
- nominal_sampling_schedule :
- 10s on, 50s off, centered at :00
- update_period :
- 1000.0
- coverage_content_type :
- physicalMeasurement
array([0.41, 0.41, 0.44, ..., 1.07, 1.06, 1.02])
- CHLOR_WETLABS_STDDEV(obs)float64...
- long_name :
- Chlorophyll concentration SD
- units :
- microgram L-1
- installed_date :
- 2021-10-04T22:23:56.294399Z
- device_name :
- WET Labs Fluorometer (1503)
- serial_number :
- 1503
- last_calibrated :
- 2016-10-25
- installed_height :
- -0.25
- firmware :
- Triplet5.33
- vendor_name :
- WET Labs
- model_name :
- BBFL2W
- model_product_page :
- http://wetlabs.com/eco-triplet-w
- nominal_sampling_schedule :
- 10s on, 50s off, centered at :00
- update_period :
- 1000.0
- coverage_content_type :
- physicalMeasurement
array([0.03, 0.02, 0.03, ..., 0.15, 0.13, 0.14])
- CDOM_MEAN(obs)float64...
- standard_name :
- concentration_of_colored_dissolved_organic_matter_in_sea_water_expressed_as_equivalent_mass_fraction_of_quinine_sulfate_dihydrate
- long_name :
- CDOM concentration
- units :
- ppb
- installed_date :
- 2021-10-04T22:23:56.294399Z
- device_name :
- WET Labs Fluorometer (1503)
- serial_number :
- 1503
- last_calibrated :
- 2016-10-25
- installed_height :
- -0.25
- firmware :
- Triplet5.33
- vendor_name :
- WET Labs
- model_name :
- BBFL2W
- model_product_page :
- http://wetlabs.com/eco-triplet-w
- nominal_sampling_schedule :
- 10s on, 50s off, centered at :00
- update_period :
- 1000.0
- coverage_content_type :
- physicalMeasurement
array([0.91, 0.85, 0.79, ..., 0.87, 0.94, 0.98])
- CDOM_STDDEV(obs)float64...
- long_name :
- CDOM concentration SD
- units :
- ppb
- installed_date :
- 2021-10-04T22:23:56.294399Z
- device_name :
- WET Labs Fluorometer (1503)
- serial_number :
- 1503
- last_calibrated :
- 2016-10-25
- installed_height :
- -0.25
- firmware :
- Triplet5.33
- vendor_name :
- WET Labs
- model_name :
- BBFL2W
- model_product_page :
- http://wetlabs.com/eco-triplet-w
- nominal_sampling_schedule :
- 10s on, 50s off, centered at :00
- update_period :
- 1000.0
- coverage_content_type :
- physicalMeasurement
array([0.13, 0.23, 0.19, ..., 0.1 , 0.07, 0.12])
- BKSCT_RED_MEAN(obs)float64...
- long_name :
- Optical backscatter at 650 nm
- units :
- (m sr)-1
- installed_date :
- 2021-10-04T22:23:56.294399Z
- device_name :
- WET Labs Fluorometer (1503)
- serial_number :
- 1503
- last_calibrated :
- 2016-10-25
- installed_height :
- -0.25
- firmware :
- Triplet5.33
- vendor_name :
- WET Labs
- model_name :
- BBFL2W
- model_product_page :
- http://wetlabs.com/eco-triplet-w
- nominal_sampling_schedule :
- 10s on, 50s off, centered at :00
- update_period :
- 1000.0
- coverage_content_type :
- physicalMeasurement
array([0.000279, 0.000282, 0.000289, ..., 0.000242, 0.00022 , 0.000224])
- BKSCT_RED_STDDEV(obs)float64...
- long_name :
- Optical backscatter at 650 nm SD
- units :
- (m sr)-1
- installed_date :
- 2021-10-04T22:23:56.294399Z
- device_name :
- WET Labs Fluorometer (1503)
- serial_number :
- 1503
- last_calibrated :
- 2016-10-25
- installed_height :
- -0.25
- firmware :
- Triplet5.33
- vendor_name :
- WET Labs
- model_name :
- BBFL2W
- model_product_page :
- http://wetlabs.com/eco-triplet-w
- nominal_sampling_schedule :
- 10s on, 50s off, centered at :00
- update_period :
- 1000.0
- coverage_content_type :
- physicalMeasurement
array([9.0e-06, 1.1e-05, 2.3e-05, ..., 8.6e-05, 2.7e-05, 2.0e-05])
- WATER_CURRENT_SPEED_MEAN(obs)float64...
- long_name :
- Water Current Speed
- units :
- m s-1
- installed_date :
- 2020-06-09T23:52:15.960723Z
- device_name :
- Teledyne ADCP (24707)
- serial_number :
- 24707
- installed_height :
- -1.9
- vendor_name :
- Teledyne
- model_name :
- Workhorse WHM300-I-UG1
- model_product_page :
- http://rdinstruments.com/product/adcp/sentinel-adcp
- nominal_sampling_schedule :
- 300s on, 300s off, centered at :00
- update_period :
- 1000.0
- coverage_content_type :
- physicalMeasurement
array([0.128, 0.113, 0.113, ..., nan, 0.25 , 0.251])
- WATER_CURRENT_DIRECTION_MEAN(obs)float64...
- long_name :
- Water Current Direction
- units :
- degree
- installed_date :
- 2020-06-09T23:52:15.960723Z
- device_name :
- Teledyne ADCP (24707)
- serial_number :
- 24707
- installed_height :
- -1.9
- vendor_name :
- Teledyne
- model_name :
- Workhorse WHM300-I-UG1
- model_product_page :
- http://rdinstruments.com/product/adcp/sentinel-adcp
- nominal_sampling_schedule :
- 300s on, 300s off, centered at :00
- update_period :
- 1000.0
- coverage_content_type :
- physicalMeasurement
- remark :
- 0 degrees is north, 90 degrees is east, etc.
array([110.4, 110.6, 116.4, ..., nan, 183.8, 177.6])
- corrected_backscatter_at_650nm(obs)float64...
- long_name :
- Corrected backscatter at 650 nm
- units :
- m-1 sr-1
- coverage_content_type :
- physicalMeasurement
- valid_min :
- 0.0
- valid_max :
- 1.0
array([0.000728, 0.00146 , 0.001467, ..., 0.001059, 0.001059, 0.001059])
- particulate_organic_carbon(obs)float64...
- long_name :
- Particulate Organic Carbon
- standard_name :
- mole_concentration_of_particulate_matter_expressed_as_carbon_in_sea_water
- units :
- umol L-1
- coverage_content_type :
- physicalMeasurement
- valid_min :
- 0.0
- valid_max :
- 100.0
array([ 9.835801, 22.479918, 22.596582, ..., 15.539021, 15.539021, 15.539021])
- calibrated_chlorophyll(obs)float64...
- long_name :
- Calibrated chlorophyll concentrations
- standard_name :
- mass_concentration_of_chlorophyll_in_sea_water
- units :
- ug L-1
- coverage_content_type :
- physicalMeasurement
- valid_min :
- 0.0
- valid_max :
- 1.0
array([0.120391, 0.120391, 0.140395, ..., 0.560483, 0.553815, 0.527143])
- title :
- S-MODE Pilot Campaign Fall 2021 Temperature, Salinity and several other nonadcp variables from Saildrone 1073
- summary :
- 1min surface metereological and oceanographic data from Saildrone 1073 collected during NASA's Sub-Mesoscale Ocean Dynamics Experiment (S-MODE) Pilot Campaign in Fall 2021.
- ncei_template_version :
- NCEI_NetCDF_Trajectory_Template_v2.0
- Conventions :
- CF-1.8, ACDD-1.3
- netcdf_version :
- 4.6.3
- featureType :
- trajectory
- cdm_data_type :
- Trajectory
- standard_name_vocabulary :
- CF Standard Name Table v72
- description :
- Saildrone NetCDF Format
- creator_name :
- Cesar B Rocha
- platform :
- In Situ Ocean-based Platforms > USV > Saildrone
- institution :
- UConn/
- creator_email :
- cesar.rocha@uconn.edu
- creator_url :
- date_created :
- 2022-07-06T00:00:00Z
- interval :
- 60.0
- time_coverage_resolution :
- PT1M
- time_coverage_duration :
- P18DT23H59M59S
- area :
- Bay Area, California
- data_mode :
- realtime
- drone_id :
- 1073
- naming_authority :
- gov.nasa
- uuid :
- 4d91d3c3-d11c-41cc-a599-9939883528af
- project :
- Sub-Mesoscale Ocean Dynamics Experiment (S-MODE)
- time_in :
- minutes
- source :
- license :
- Issued under Creative Commons CC BY 4.0.
- nodc_template_version :
- NODC_NetCDF_Trajectory_Template_v2.0
- wmo_id :
- 1801589
- geospatial_lat_min :
- 37.0647808
- geospatial_lat_max :
- 37.6938496
- geospatial_lat_units :
- degrees_north
- geospatial_lon_units :
- degrees_east
- DOI :
- 10.5067/SMODE-SDRON
- keywords :
- EARTH SCIENCE > ATMOSPHERE > OCEAN WINDS > SURFACE WINDS, EARTH SCIENCE > OCEANS > SALINITY/DENSITY > CONDUCTIVITY, EARTH SCIENCE > OCEANS > OCEAN OPTICS > CHLOROPHYLL, EARTH SCIENCE > OCEANS > SALINITY/DENSITY > SALINITY, EARTH SCIENCE > OCEANS > OCEAN TEMPERATURE > SEA SURFACE TEMPERATURE, EARTH SCIENCE > ATMOSPHERE > ATMOSPHERIC PRESSURE > ATMOSPHERIC PRESSURE MEASUREMENTS, EARTH SCIENCE > ATMOSPHERE > ATMOSPHERIC TEMPERATURE > AIR TEMPERATURE, EARTH SCIENCE > OCEANS > OCEAN CHEMISTRY > OXYGEN
- keywords_vocabulary :
- NASA Global Change Master Directory (GCMD) Science Keywords
- platform_vocabulary :
- GCMD platform keywords
- instrument :
- In Situ/Laboratory Instruments > Profilers/Sounders
- instrument_vocabulary :
- GCMD instrument keywords
- processing_level :
- L2
- references :
- product_version :
- 1.0
- history :
- 1min Cesar B Rocha - download Saildrone daily 2022-01-27 files from ftp.saildrone.com and create NetCDF
- metadata_link :
- https://doi.org/10.5067/SMODE-SDRON
- creator_type :
- person
- creator_institution :
- UConn/
- program :
- NASA Earth Venture Suborbital-3 (EVS-3)
- contributor_name :
- Frederick Bingham
- contributor_role :
- Project Data Manager
- publisher_name :
- Physical Oceanography Distributed Active Archive Center, Jet Propulsion Laboratory, NASA
- publisher_email :
- podaac@podaac.jpl.nasa.gov
- publisher_url :
- https://podaac.jpl.nasa.gov
- publisher_type :
- institution
- publisher_institution :
- NASA/JPL/PODAAC
- sea_name :
- Pacific
- geospatial_vertical_units :
- m
- geospatial_vertical_positive :
- down
- comment :
- Biogeochemical proxies created by Sarah Lang and Melissa Omand
- acknowledgement :
- We thank Paban Bhuyan (UConn) and Kim Sparling (SAILDRONE INC) and Dave Peacock (SAILDRONE INC) for help with generating this data file. This work is a contribution to the S-MODE project, an EVS-3 Investigation awarded under NASA Research Announcement NNH17ZDA001N-EVS3.
- time_coverage_start :
- 2021-10-19T00:00:00Z
- time_coverage_end :
- 2021-11-06T23:59:00Z
- geospatial_lon_min :
- -125.57976388888889
- geospatial_lon_max :
- -122.39241944444444
- id :
- SMODE_LX_SAILDRONES_V1
A few quick-and-dirty plots
ds.plot.scatter(x='longitude',y='latitude')
plt.title('SD-'+str(int(ds.trajectory)))
Text(0.5, 1.0, 'SD-1073')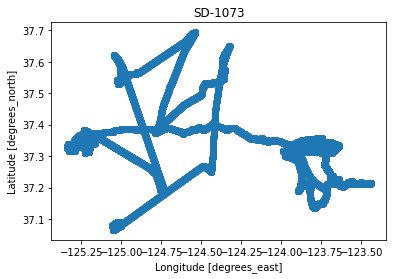
# plot seabird-37 temperature data
ds.TEMP_SBE37_MEAN.plot()
plt.title('SD-'+str(int(ds.trajectory)))
Text(0.5, 1.0, 'SD-1073')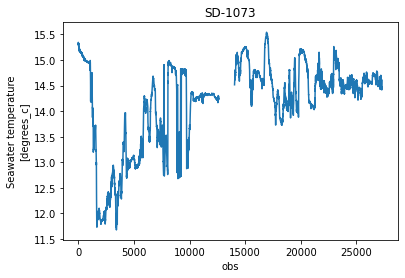
# plot data as a timeseries
fig, ax = plt.subplots(figsize=(12,4))
ds.TEMP_SBE37_MEAN.plot(x='time',ax=ax)
ax.set_xlabel('')
plt.title('SD-'+str(int(ds.trajectory)))
Text(0.5, 1.0, 'SD-1073')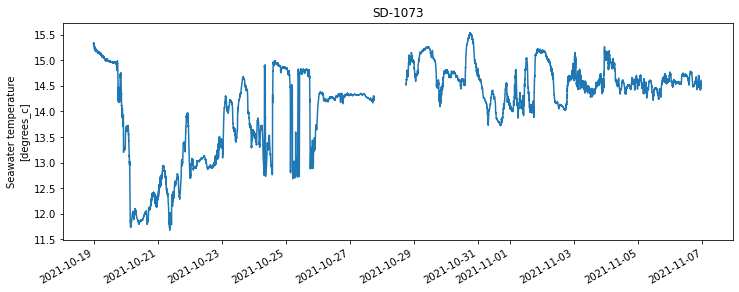
# plot dat as a function of longitude
fig, ax = plt.subplots(figsize=(12,4))
ds.TEMP_SBE37_MEAN.plot(x='longitude',ax=ax)
plt.title('SD-'+str(int(ds.trajectory)))
Text(0.5, 1.0, 'SD-1073')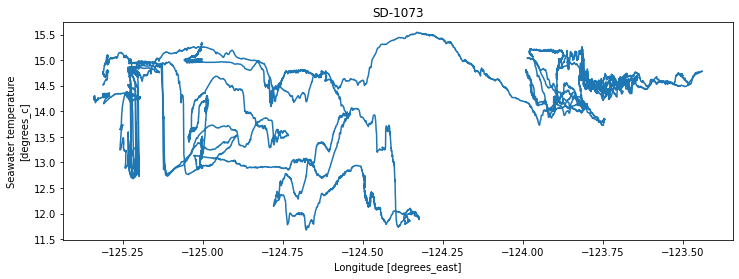
im = ds.plot.scatter(x='longitude',y='latitude',c=ds.TEMP_SBE37_MEAN)
plt.colorbar(im,label=ds.TEMP_SBE37_MEAN.attrs['standard_name'])
plt.title('SD-'+str(int(ds.trajectory)))
Text(0.5, 1.0, 'SD-1073')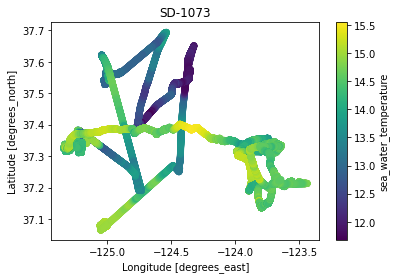
# time speed of saildrone speed relative to ground
fig, ax = plt.subplots(figsize=(12,4))
ds.SOG_FILTERED_MEAN.plot(x='time')
plt.title('SD-'+str(int(ds.trajectory)))
Text(0.5, 1.0, 'SD-1073')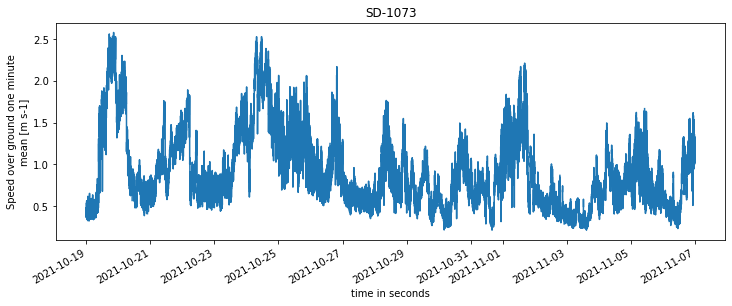
Example: calculate density, a derived quantitty
ds['sigma0'] = gsw.sigma0(ds.SAL_SBE37_MEAN,ds.TEMP_SBE37_MEAN)

# ds.sigma0.attrs['standard_name'] = 'sea_water_potential_density'
# ds.sigma0.attrs['long_name'] = 'Seawater potential density'
# ds.sigma0.attrs['units'] = 'kg m^{-3}'
# Now plot temperature, salinity and density
fig, axs = plt.subplots(1,3,figsize=(18,4))
variables = [
ds.TEMP_SBE37_MEAN,
ds.SAL_SBE37_MEAN,
ds.sigma0
]
cmaps = ['jet', 'viridis','Spectral_r']
for ax, var, cmap in zip(axs, variables, cmaps):
im = ax.scatter(ds.longitude,ds.latitude,c=var,cmap=cmap)
fig.colorbar(im,ax=ax,label=var.attrs['long_name'] + ' [' + var.attrs['units'] + ']')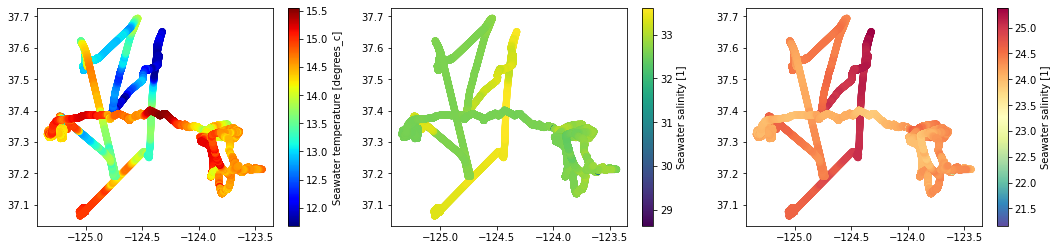
All saildrones
Oftentimes it is conveninent to have all saildrone data in a single dataset for easy manipulation and comparisons.
files = glob.glob(data_path + short_name + '/*_nonadcp_*')

drop_vars = ['TEMP_DEPTH_HALFMETER_MEAN',
             'TEMP_DEPTH_HALFMETER_STDDEV',
             'corrected_backscatter_at_650nm',
             'particulate_organic_carbon',
             'calibrated_chlorophyll'
            ]

# loop through files (i.e., different saildrones),
# open dataset, drop variables not available for all
# saildrones and concatenate datasets along the trajectory
# dimension

for file in files:

    foo = xr.open_dataset(file)

    for drop_var in drop_vars:
        if drop_var in foo.variables:
            foo = foo.drop(drop_var)

    foo = foo.isel(trajectory=0).swap_dims(
        {'obs':'time'}
    ).expand_dims('trajectory')

    if file == files[0]:
        nonadcp = foo
    else:
        nonadcp = xr.concat([nonadcp,foo],dim='trajectory')
# single saildrone dataset is a subset of nonadcp dataset
nonadcp73 = nonadcp.sel(trajectory=1073.)# project 1073's trajectory
nonadcp73.plot.scatter(x='longitude',y='latitude')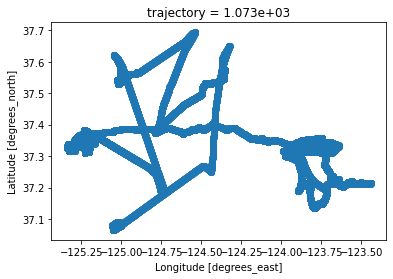
# plot all trajectories
for sd in nonadcp.trajectory:
    nonadcp.sel(trajectory=sd).plot.scatter(x='longitude',y='latitude',label=int(sd.values))

plt.legend()
plt.title('')
Text(0.5, 1.0, '')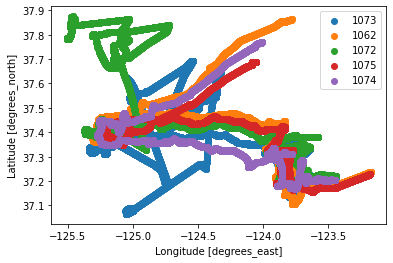
ADCP data
Single file: saildrone 1072
adcp72 = xr.open_dataset(data_path + short_name + '/SMODE_PFC_saildrone_adcp_1072.nc').isel(trajectory=0)
adcp73 = xr.open_dataset(data_path + short_name + '/SMODE_PFC_saildrone_adcp_1073.nc').isel(trajectory=0)
# Slice the data in time, assigning a 3-day subset
# virtual mooring
# t0 = np.datetime64('2021-11-23T12')
# t1 = np.datetime64('2021-11-28T12')
# formation sailing
# t0 = np.datetime64('2021-11-01T04')
# t1 = np.datetime64('2021-11-01T18')
# comparison with oceanus
t0 = np.datetime64('2021-11-06T16')
t1 = np.datetime64('2021-11-06T20')
subset72 = adcp72.where((adcp72.time>=t0)&(adcp72.time<=t1),drop=True)
subset73 = adcp73.where((adcp73.time>=t0)&(adcp73.time<=t1),drop=True) depth_bin = 2
fig, ax = plt.subplots(figsize=(12,8))
for subset in [subset72,subset73]:
ax.quiver(
subset.longitude,
subset.latitude,
subset.vel_east.isel(cell_depth=depth_bin),
subset.vel_north.isel(cell_depth=depth_bin),
scale = 6
)
ax.set_ylim(37.18,37.26)
ax.set_aspect(np.cos(37.22*np.pi/180))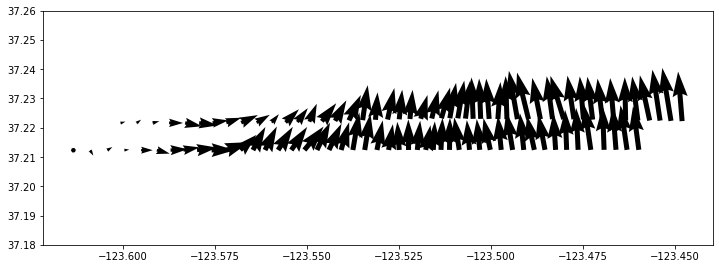
# Example: vertical sections
fig, axs = plt.subplots(2,1, figsize=(12,10))
subset72.vel_east.where(subset72.percent_good>95).plot(x='longitude',y='cell_depth',ax=axs[0])
subset72.vel_north.where(subset72.percent_good>95).plot(x='longitude',y='cell_depth',ax=axs[1])
[ax.set_ylim(80,0) for ax in axs]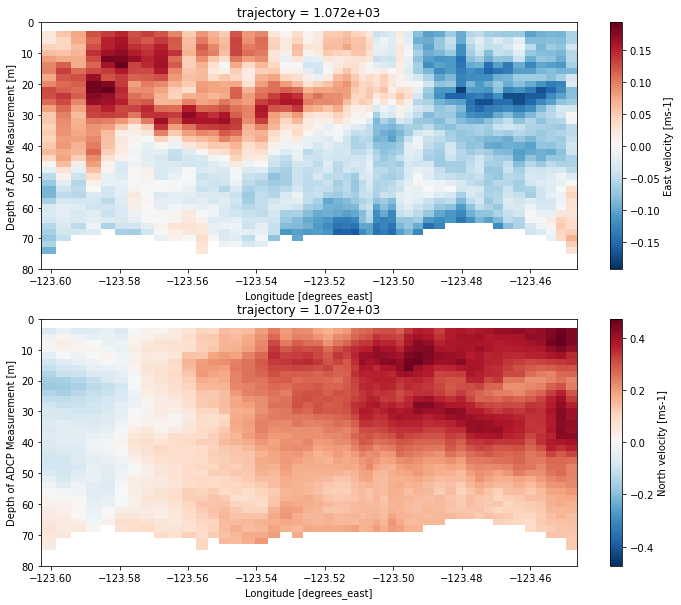
# Example: calculate and plot vertical shear
fig, ax = plt.subplots(figsize=(12,4))
kw = {'vmin': -0.03,'vmax': 0.03,'cmap': 'RdBu_r'}

subset.vel_north.differentiate('cell_depth').where(subset.percent_good>95).plot(x='time',**kw)

plt.ylim(80,0)
plt.xlim(t0,t1)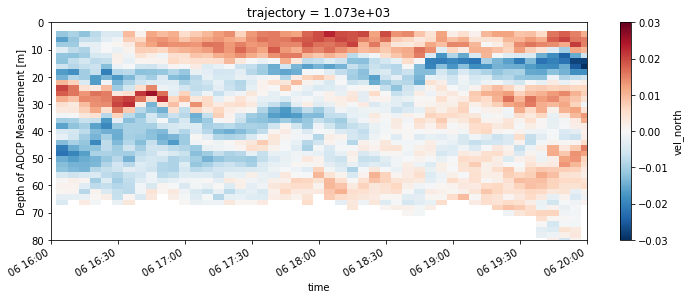
Compare saildrone ADCP data with R/V Oceanus data
A major goal of the S-MODE Pilot was to compare saildrone ADCP data. Here’s one example of a simple saildrone-Oceanus velocity comparison.
# this is not working for the Oceanus ADCP
start_time = '2021-10-20T00:00:00Z'
start_time = '2021-08-01T00:00:00Z'
end_time = '2021-11-08T00:00:00Z'

short_name = 'SMODE_LX_SHIPBOARD_ADCP_V1'
!podaac-data-downloader -c $short_name -d data/$short_name --start-date $start_time --end-date $end_time -e .nc4
/Users/crocha/miniconda3/lib/python3.9/site-packages/requests/__init__.py:102: RequestsDependencyWarning: urllib3 (1.26.8) or chardet (5.0.0)/charset_normalizer (2.0.4) doesn't match a supported version!
warnings.warn("urllib3 ({}) or chardet ({})/charset_normalizer ({}) doesn't match a supported "
[2022-11-28 19:46:35,848] {podaac_data_downloader.py:243} INFO - Found 2 total files to download
[2022-11-28 19:46:35,885] {podaac_data_downloader.py:268} INFO - 2022-11-28 19:46:35.885322 SKIPPED: https://archive.podaac.earthdata.nasa.gov/podaac-ops-cumulus-protected/SMODE_LX_SHIPBOARD_ADCP_V1/S-MODE_PFC_OC2108A_adcp_os75nb.nc4
[2022-11-28 19:46:35,967] {podaac_data_downloader.py:268} INFO - 2022-11-28 19:46:35.967540 SKIPPED: https://archive.podaac.earthdata.nasa.gov/podaac-ops-cumulus-protected/SMODE_LX_SHIPBOARD_ADCP_V1/S-MODE_PFC_OC2108A_adcp_wh300.nc4
[2022-11-28 19:46:35,967] {podaac_data_downloader.py:287} INFO - Downloaded Files: 0
[2022-11-28 19:46:35,967] {podaac_data_downloader.py:288} INFO - Failed Files: 0
[2022-11-28 19:46:35,967] {podaac_data_downloader.py:289} INFO - Skipped Files: 2
[2022-11-28 19:46:36,245] {podaac_access.py:122} INFO - CMR token successfully deleted
[2022-11-28 19:46:36,245] {podaac_data_downloader.py:299} INFO - END
ds = xr.open_dataset('data/SMODE_LX_SHIPBOARD_ADCP_V1/S-MODE_PFC_OC2108A_adcp_wh300.nc4',drop_variables='depth').isel(trajectory=0)
ds['depth'] =  Dataset('data/SMODE_LX_SHIPBOARD_ADCP_V1/S-MODE_PFC_OC2108A_adcp_wh300.nc4')['depth'][0]
subset_oceanus = ds.where((ds.time>=t0)&(ds.time<=t1),drop=True) # interpolate to subset72 time
# TODO: try to resample with averaging to 5 minutes before interpolating (e.g., subset_oceanus.resample(time='5min').mean())
subset_oceanus = subset_oceanus.interp({'time': subset72.time})/Users/crocha/miniconda3/lib/python3.9/site-packages/xarray/core/missing.py:562: FutureWarning: Passing method to DatetimeIndex.get_loc is deprecated and will raise in a future version. Use index.get_indexer([item], method=...) instead.
imin = index.get_loc(minval, method="nearest")
/Users/crocha/miniconda3/lib/python3.9/site-packages/xarray/core/missing.py:563: FutureWarning: Passing method to DatetimeIndex.get_loc is deprecated and will raise in a future version. Use index.get_indexer([item], method=...) instead.
imax = index.get_loc(maxval, method="nearest")# interpolate to saildrone depth to oceanus depth
subset72['depth'] = subset72.cell_depth + 1.9 # add depth of the instrument 1.9
subset72 = subset72.swap_dims({'cell_depth': 'depth'})
subset72 = subset72.interp({'depth': subset_oceanus.depth})/Users/crocha/miniconda3/lib/python3.9/site-packages/xarray/core/missing.py:562: FutureWarning: Passing method to Float64Index.get_loc is deprecated and will raise in a future version. Use index.get_indexer([item], method=...) instead.
imin = index.get_loc(minval, method="nearest")
/Users/crocha/miniconda3/lib/python3.9/site-packages/xarray/core/missing.py:563: FutureWarning: Passing method to Float64Index.get_loc is deprecated and will raise in a future version. Use index.get_indexer([item], method=...) instead.
imax = index.get_loc(maxval, method="nearest")Visual comparison
depth_bin = 1
sc = 6

fig, ax = plt.subplots(figsize=(12,8))

q1 = plt.quiver(
        subset72.longitude,
        subset72.latitude,
        subset72.vel_east.isel(depth=depth_bin),
        subset72.vel_north.isel(depth=depth_bin),
        color='C00',scale=sc
)


q2 = plt.quiver(
        subset_oceanus.longitude,
        subset_oceanus.latitude,
        subset_oceanus.zonal_velocity_component.isel(depth=depth_bin),
        subset_oceanus.meridional_velocity_component.isel(depth=depth_bin),
        color='C02', scale=sc
)

plt.quiverkey(q1, .1, 0.815, .5, 'SD-1072',)
plt.quiverkey(q2, .1, 0.620, .5, 'R/V Oceanus',)

ax.set_ylim(37.18,37.26)
ax.set_aspect(np.cos(37.22*np.pi/180))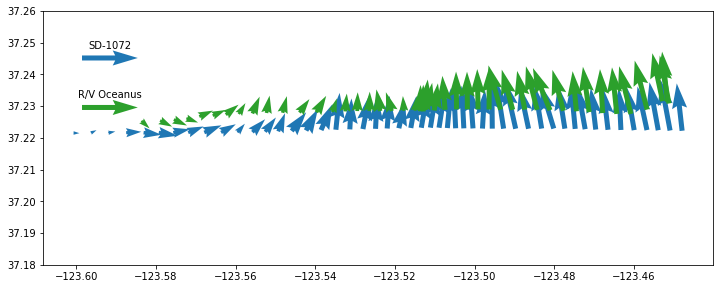
fig, axs = plt.subplots(2,1,figsize=(12,14))

kw = {'vmin': -.4,'vmax': +.4,'cmap': 'RdBu_r'}

subset_oceanus.zonal_velocity_component.plot(x='time',y='depth',ax=axs[0],**kw)
subset72.vel_east.plot(x='time',y='depth',ax=axs[1])

axs[0].set_title('R/V Oceanus')
axs[1].set_title('SD-1072')

[ax.set_ylim(80,0) for ax in axs]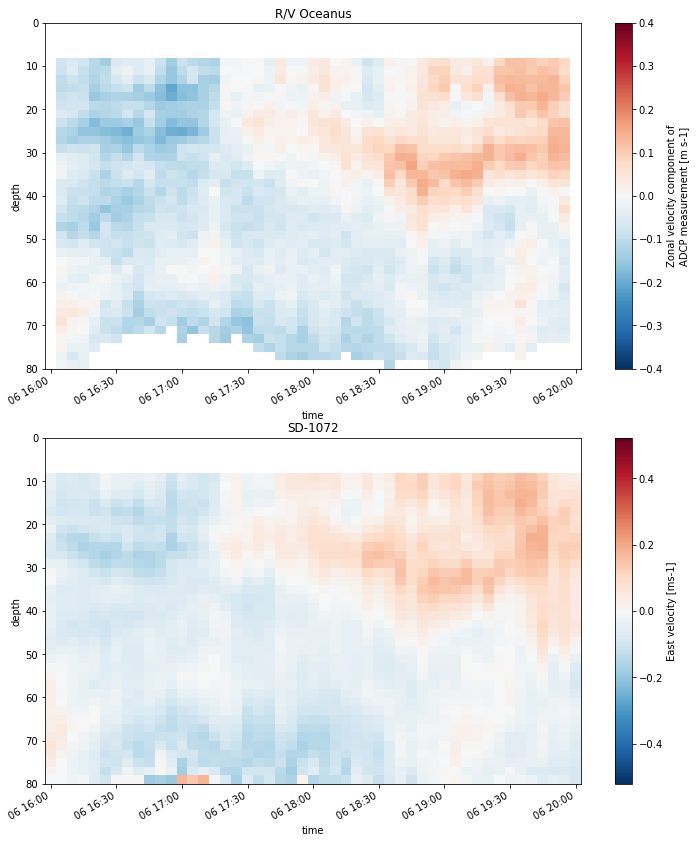
Quantitative comparison: calculate and plot velocity differences
subset_oceanus = subset_oceanus.where(subset_oceanus.depth<=70)
subset72 =  subset72.where(subset_oceanus.depth<=70)
du = subset_oceanus.zonal_velocity_component-subset72.vel_east
dv = subset_oceanus.meridional_velocity_component-subset72.vel_north_ = plt.hist(dv.values.flatten(),bins=np.arange(-.15,.156,.01))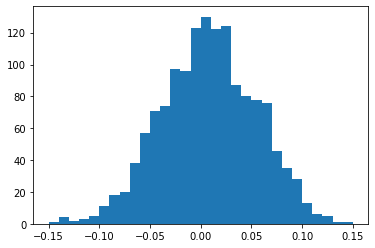
du.mean().values, dv.mean().values(array(-0.01207606), array(0.00744287))du.std().values, dv.std().values(array(0.03616049), array(0.04748247))