From the PO.DAAC Cookbook, to access the GitHub version of the notebook, follow this link.

SMAP Sea Surface Salinity and IMERG Precipitation Tutorial

Author: Julie Sanchez, NASA PO.DAAC

Summary:

This tutorial uses the Earthdata Search (https://search.earthdata.nasa.gov/) to download the data on your local machine. You will need to create an account in order to download the data.

Datasets:

  1. JPL SMAP L3 Dataset: https://podaac.jpl.nasa.gov/dataset/SMAP_JPL_L3_SSS_CAP_8DAY-RUNNINGMEAN_V5?ids=&values=&search=Smap Level 3&provider=POCLOUD

  2. GPM IMERG Late Precipitation: https://disc.gsfc.nasa.gov/datasets/GPM_3IMERGDL_06/summary?keywords=gpm imerg

Learning Objectives:

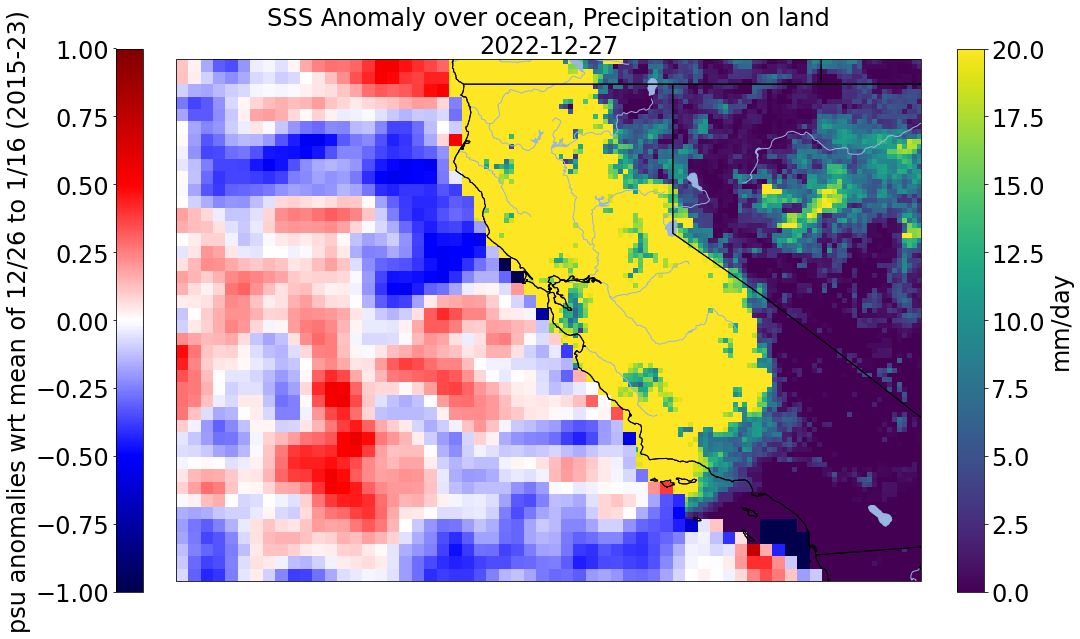
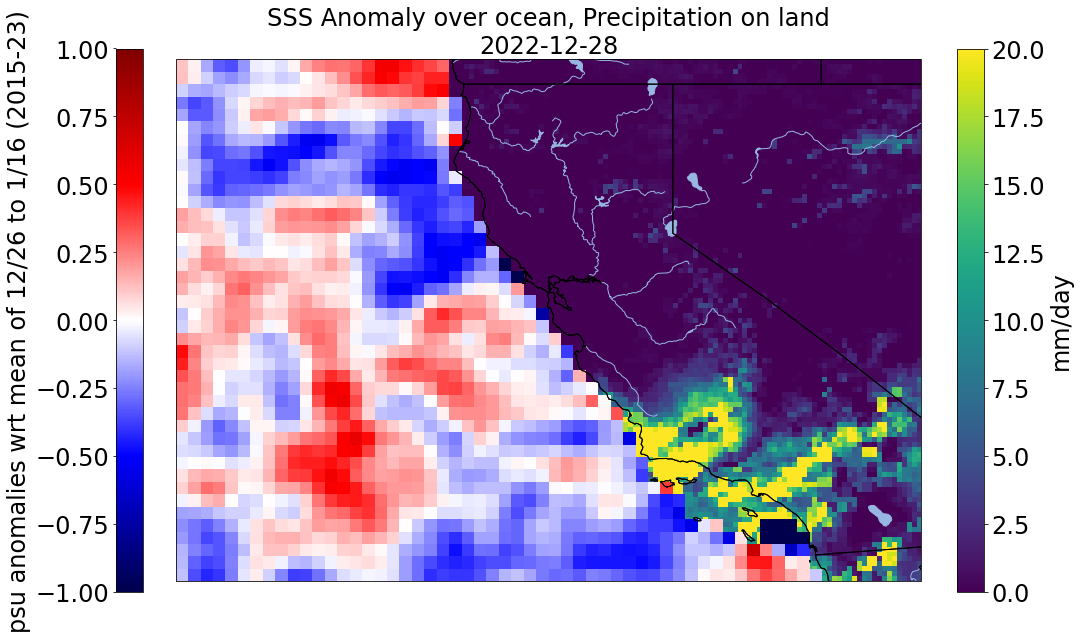
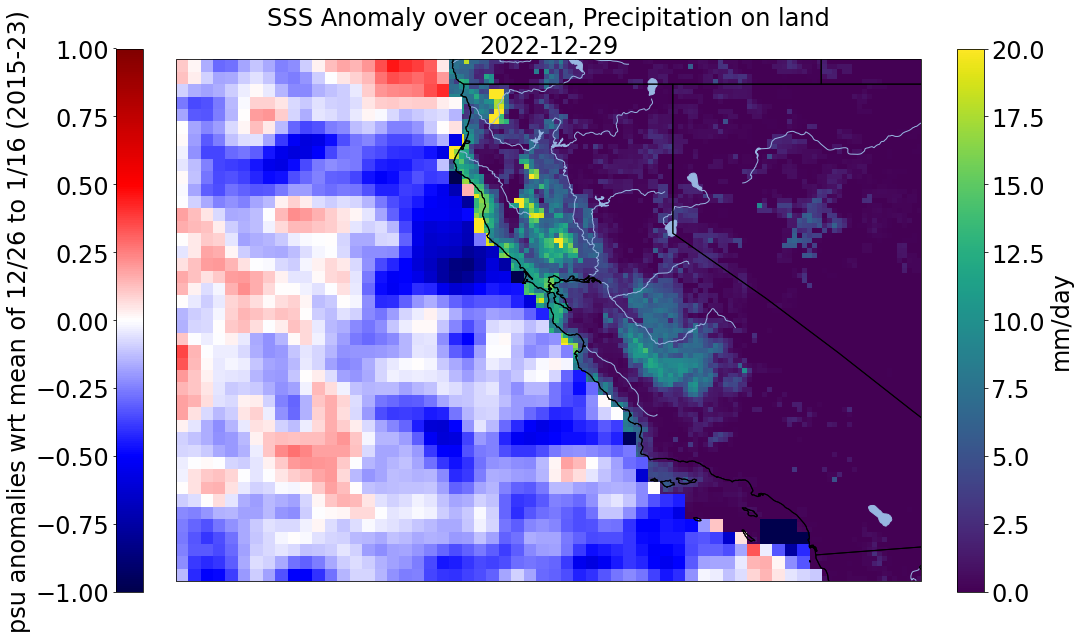
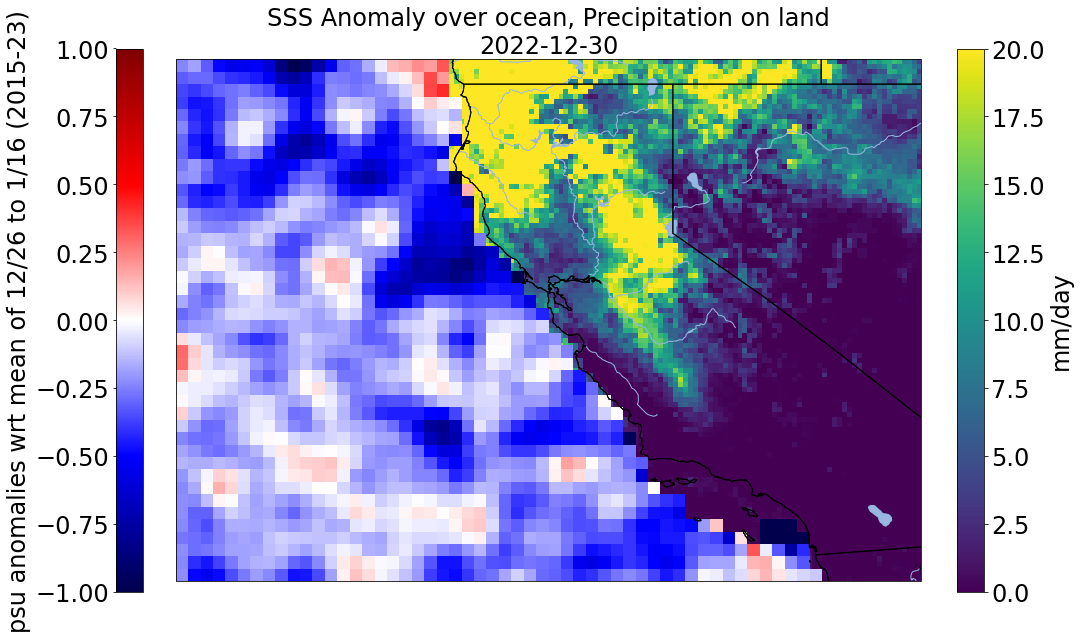
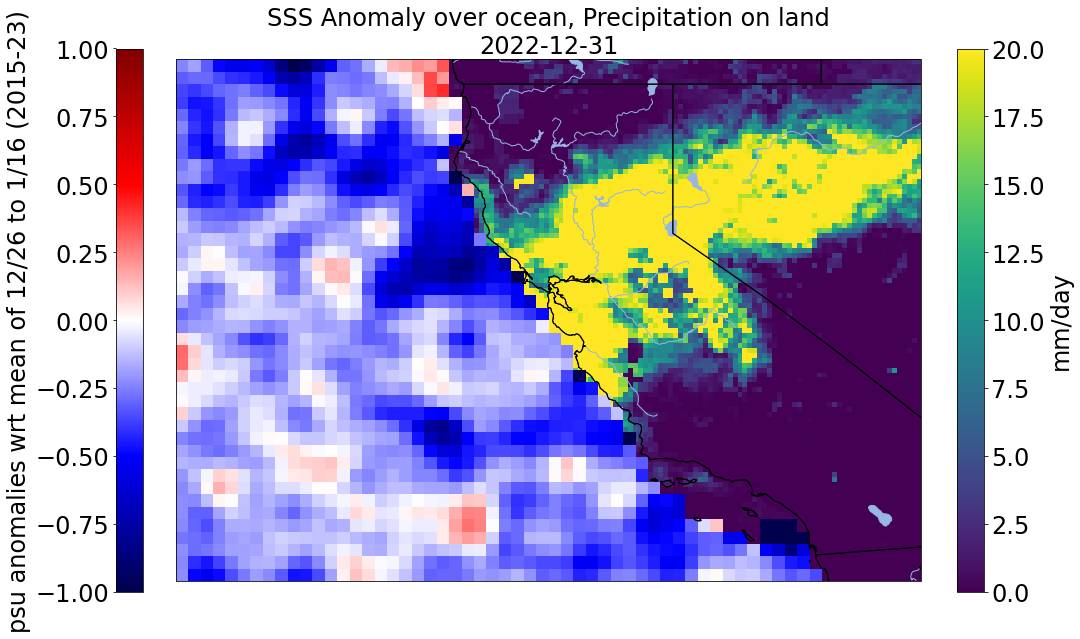
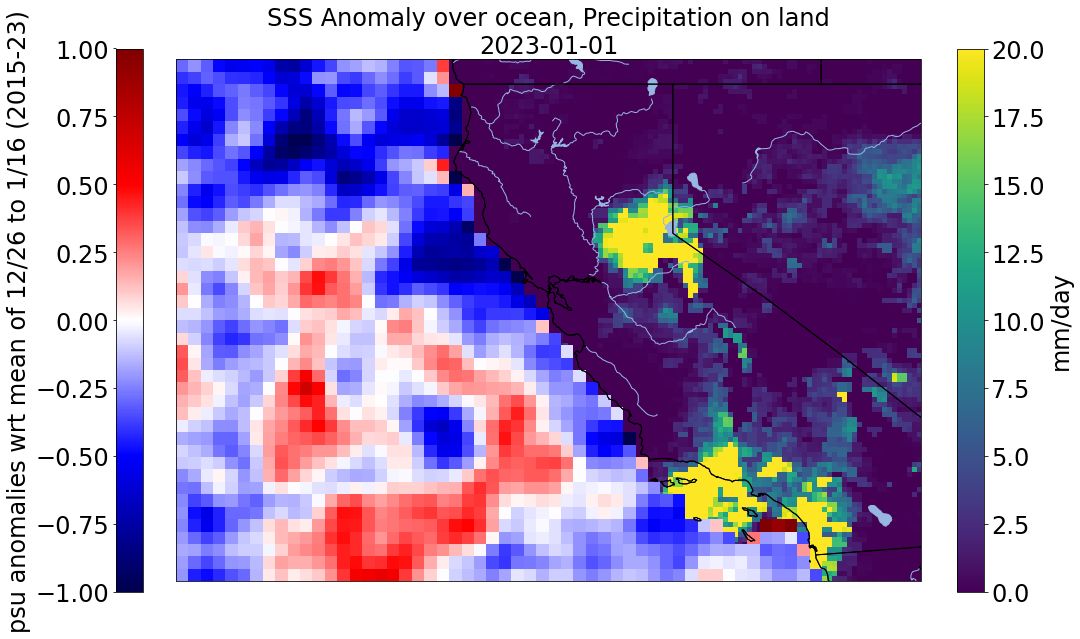
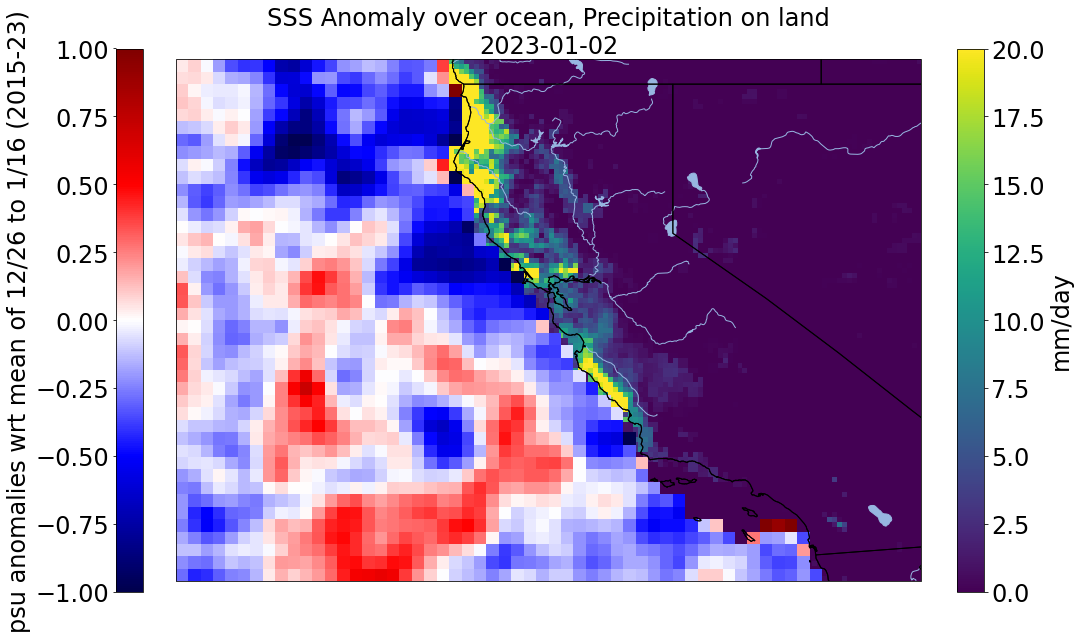
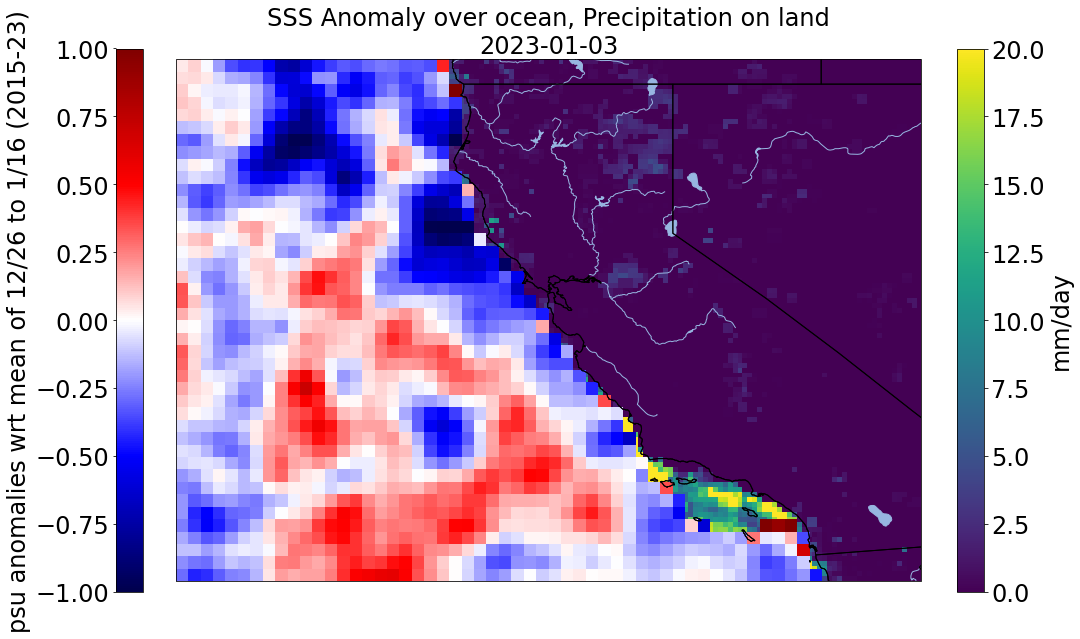
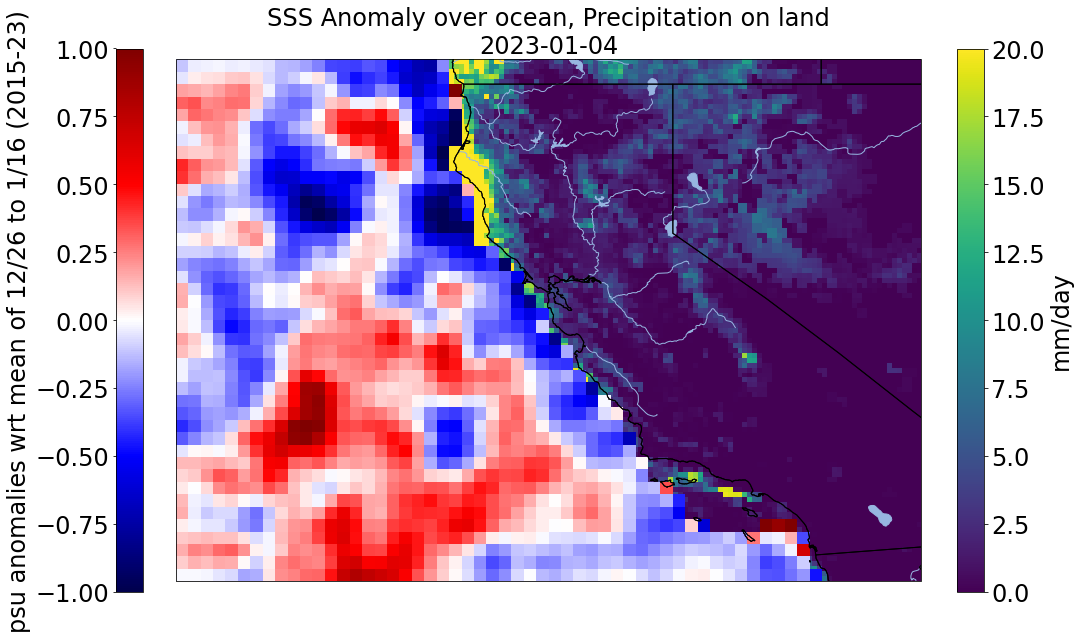
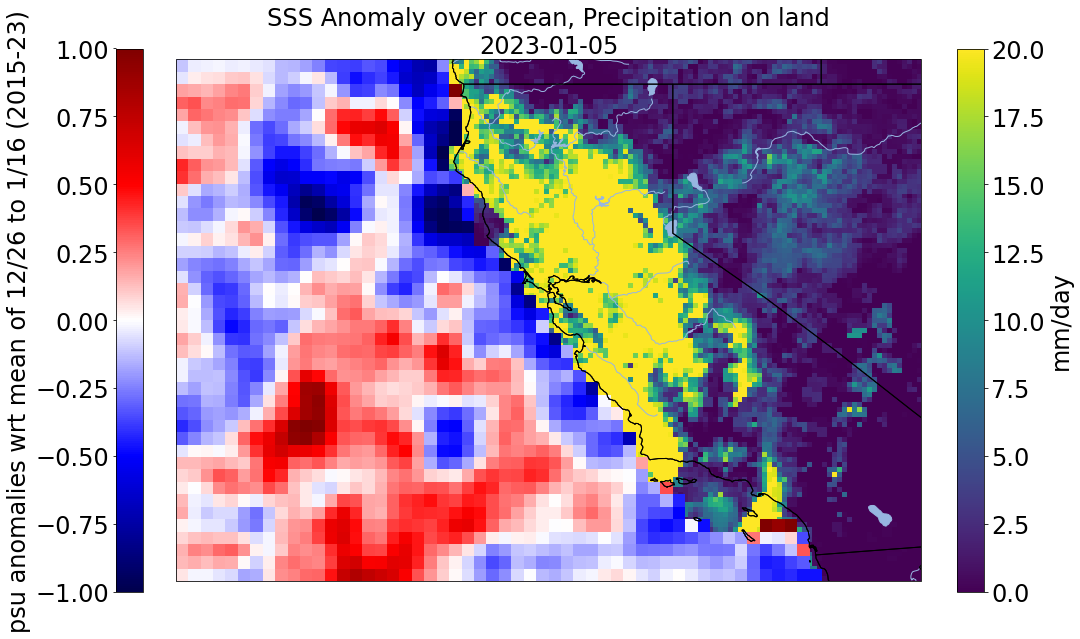
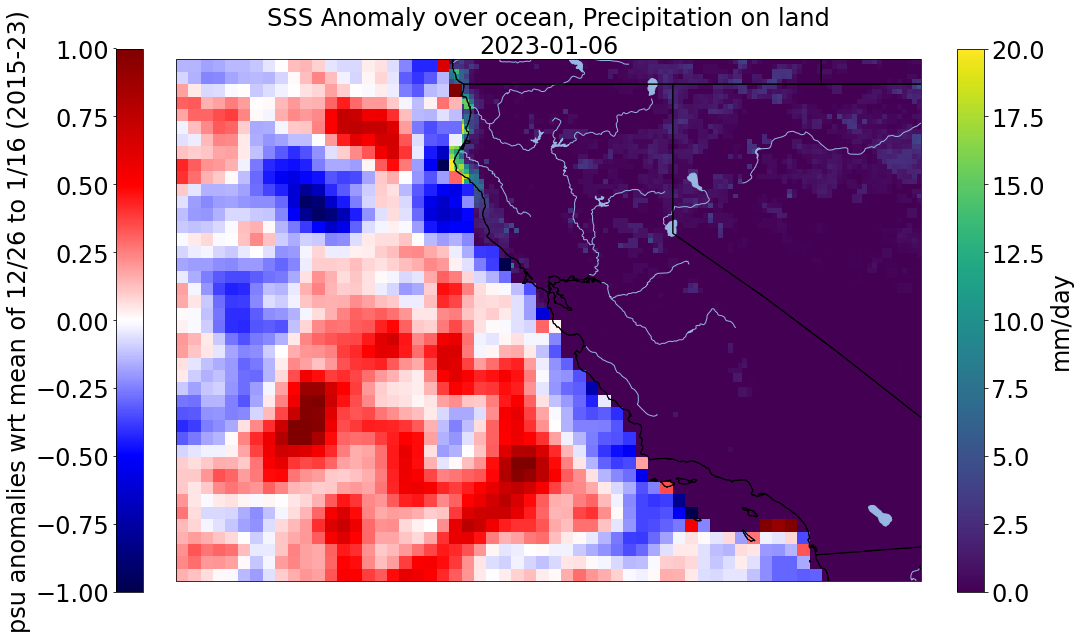
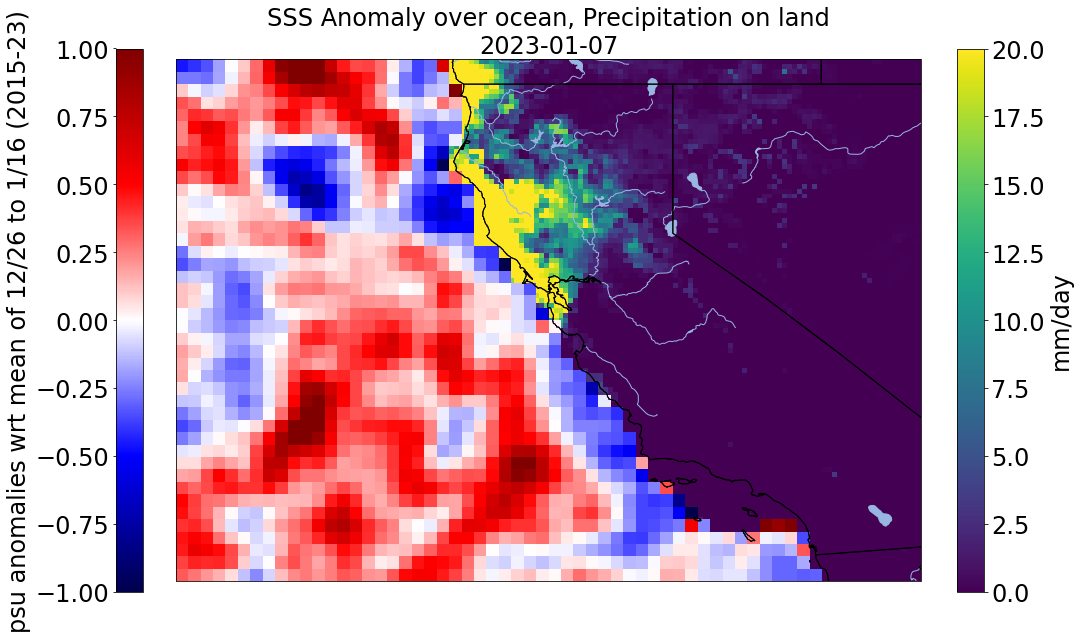
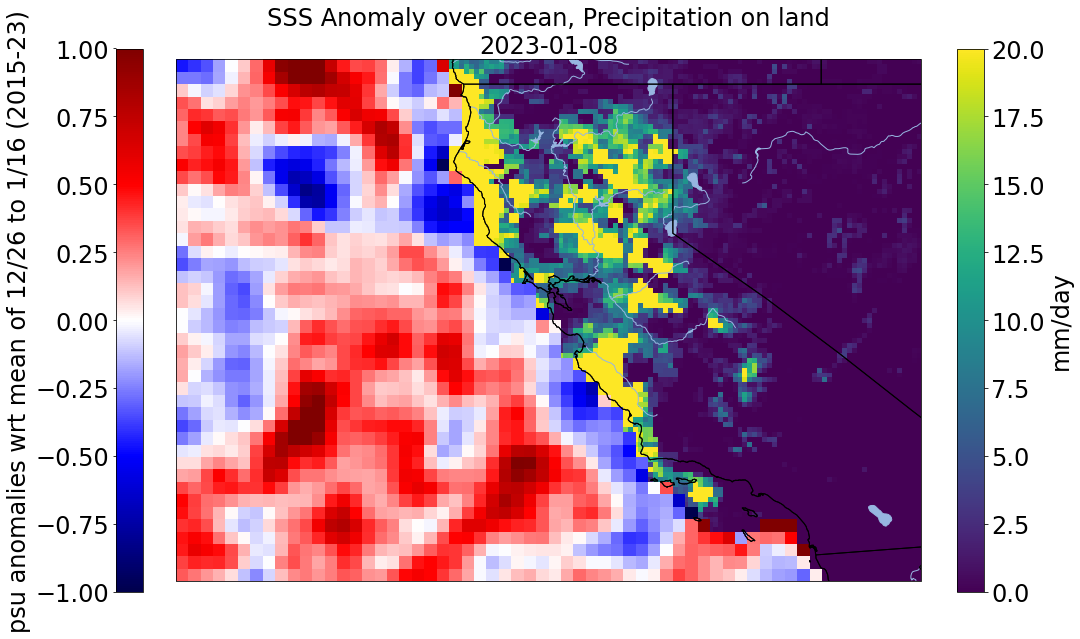
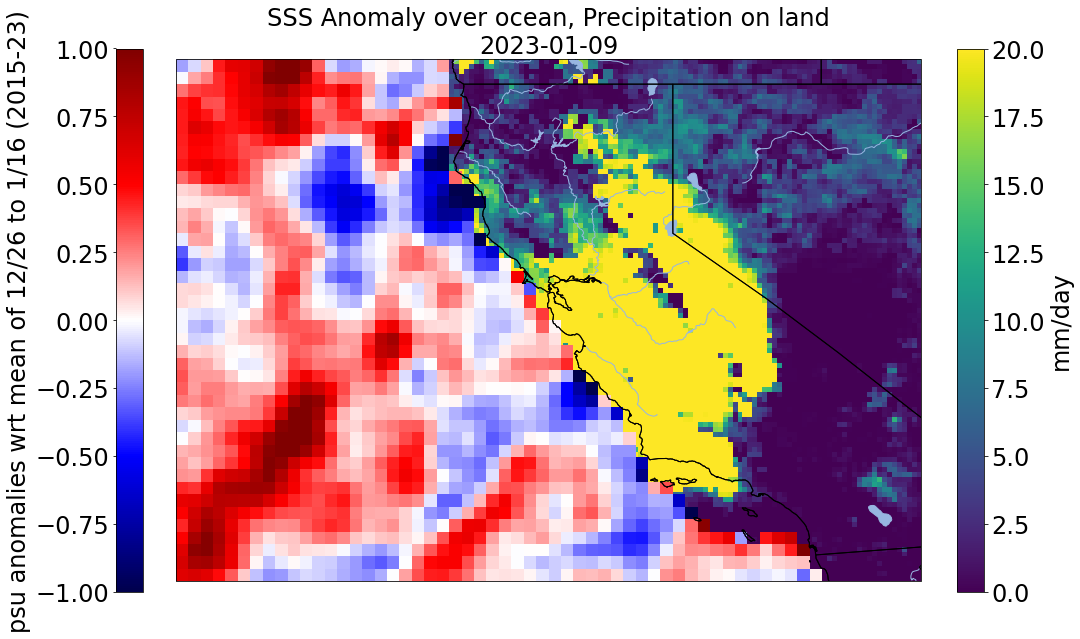
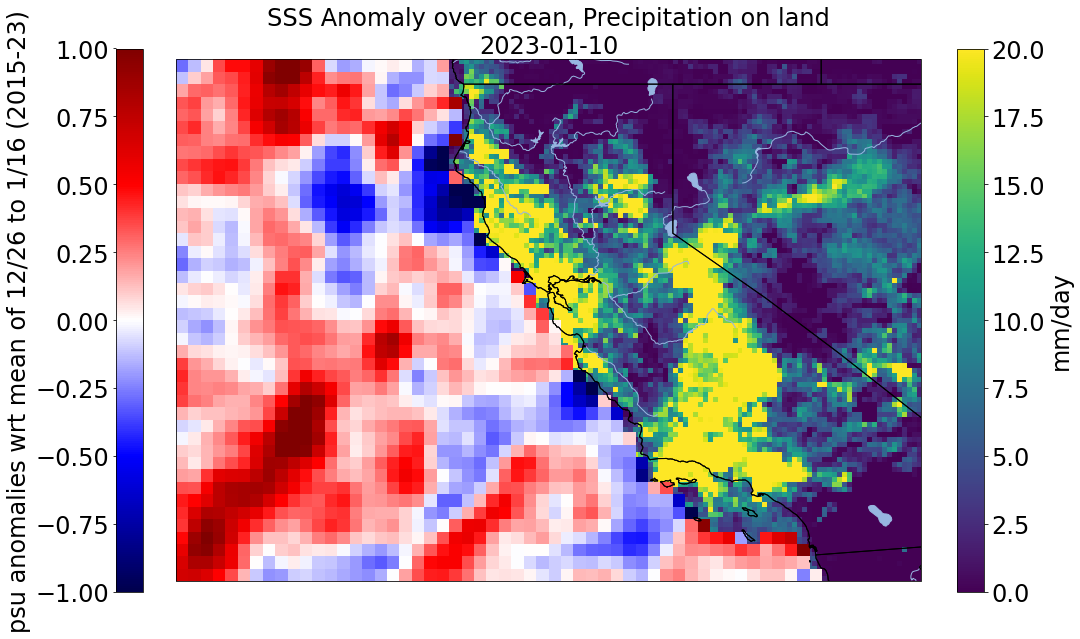
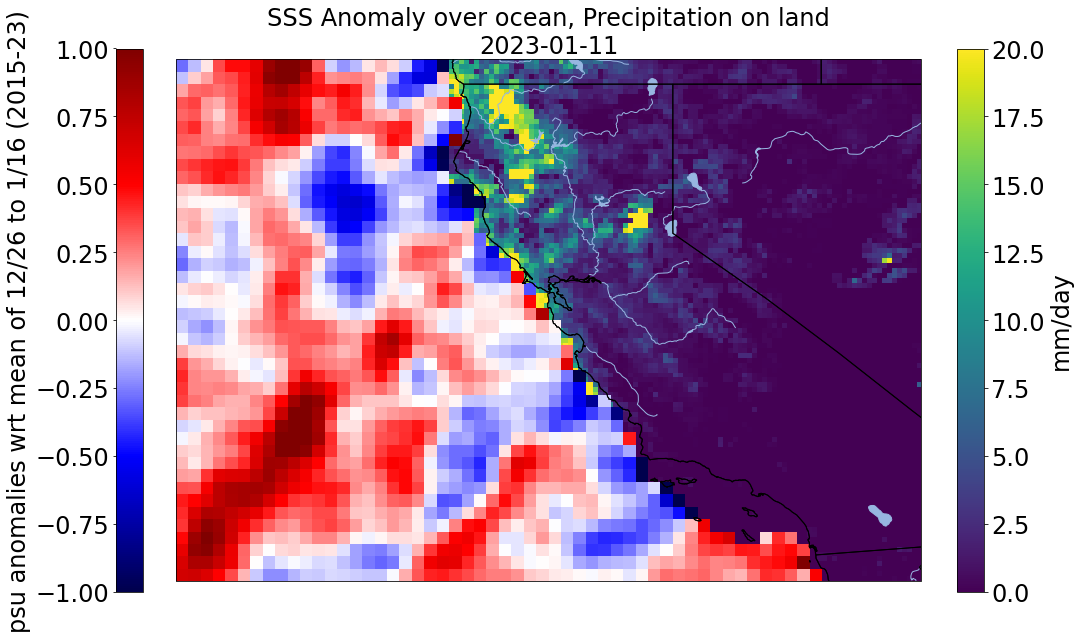
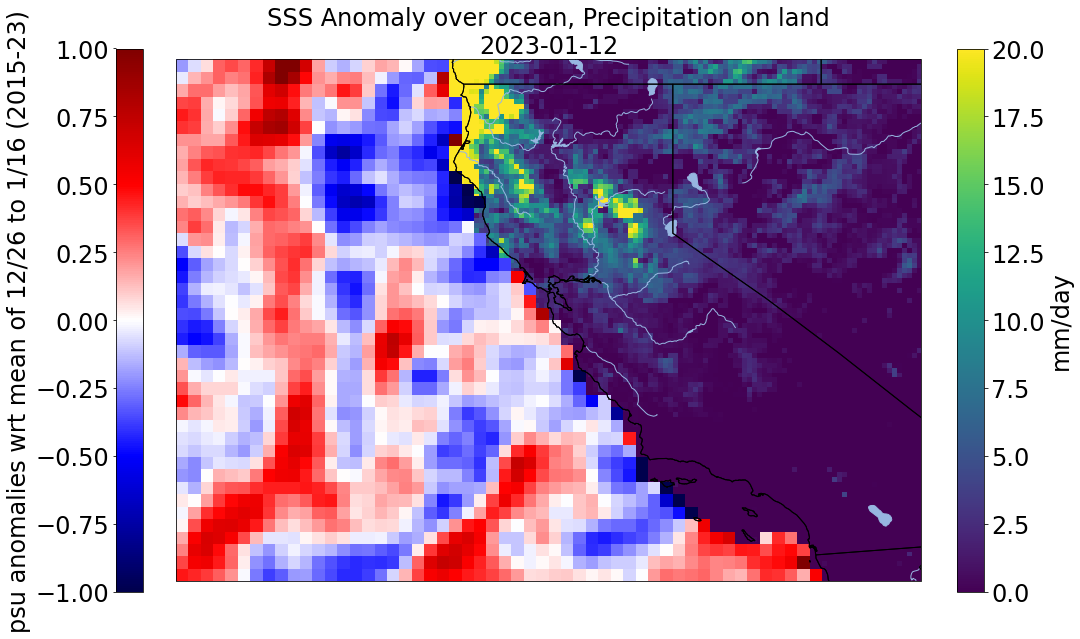
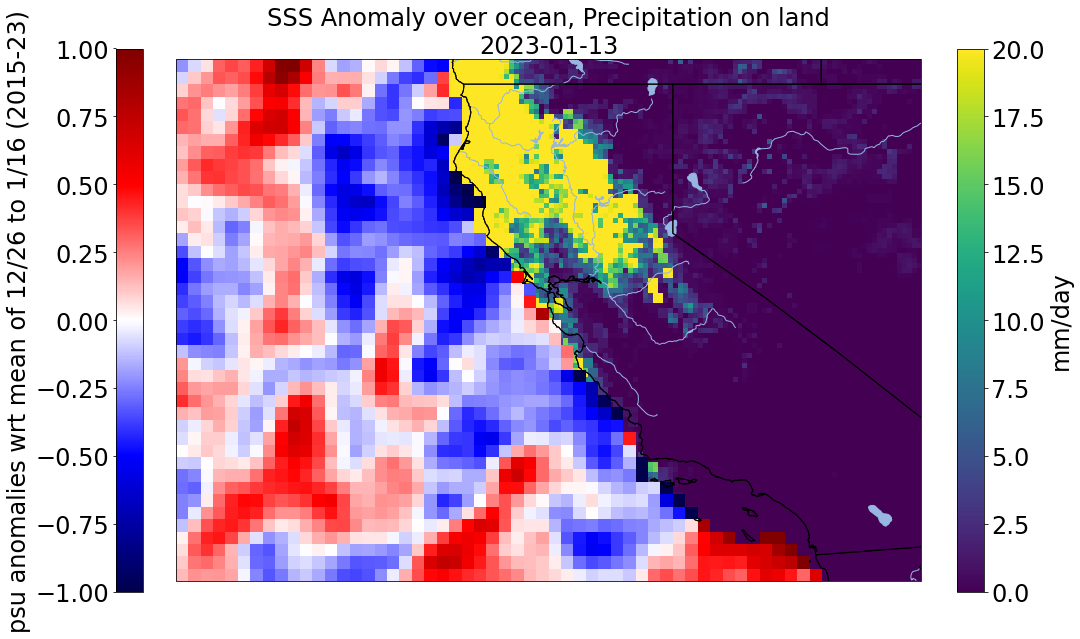
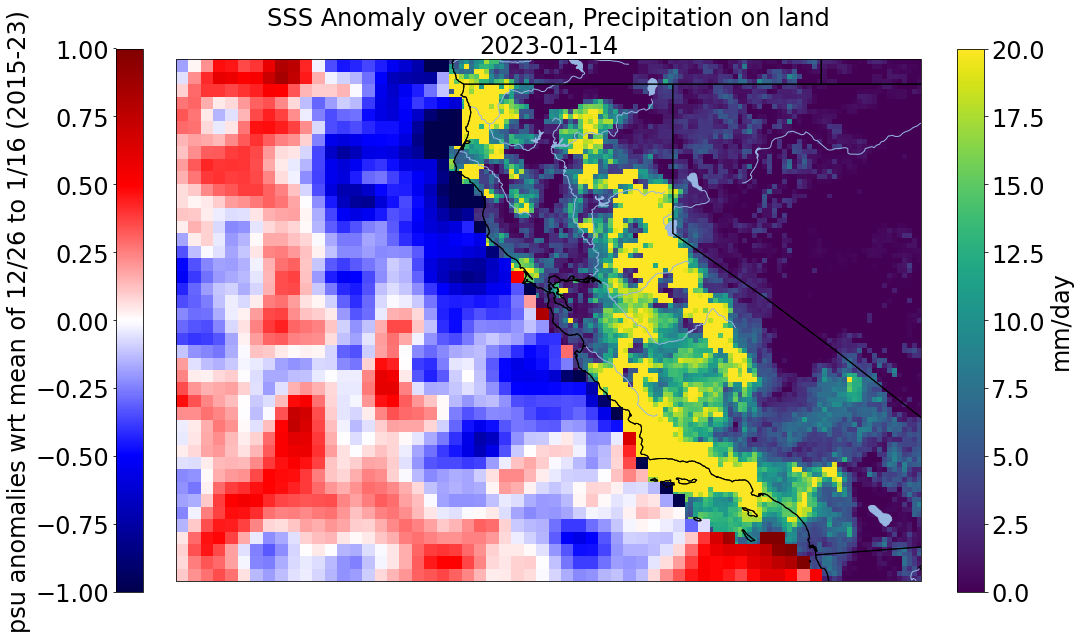
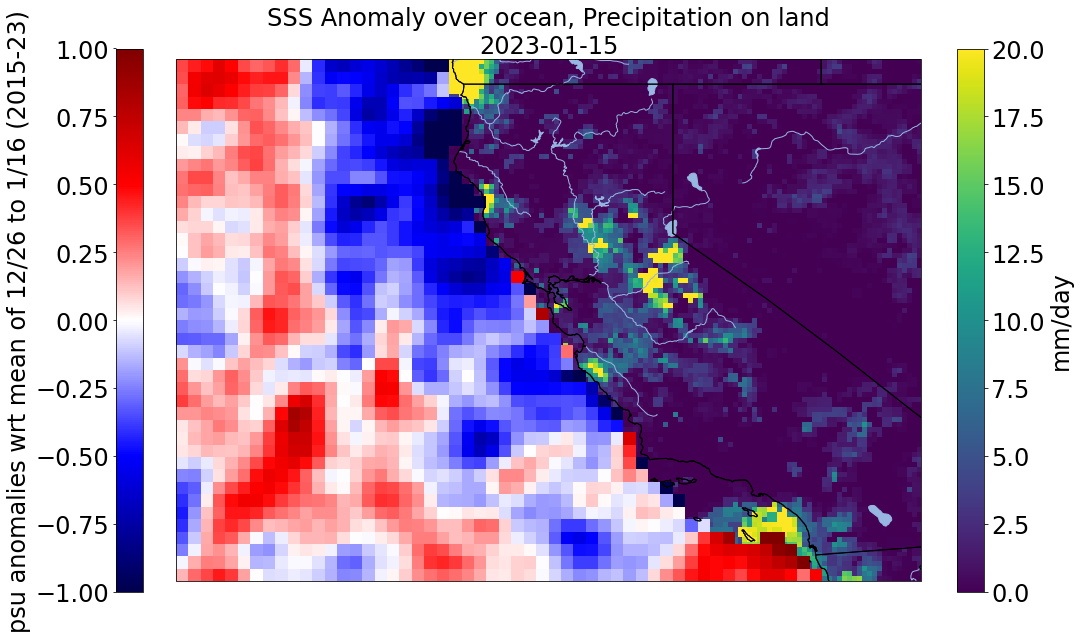
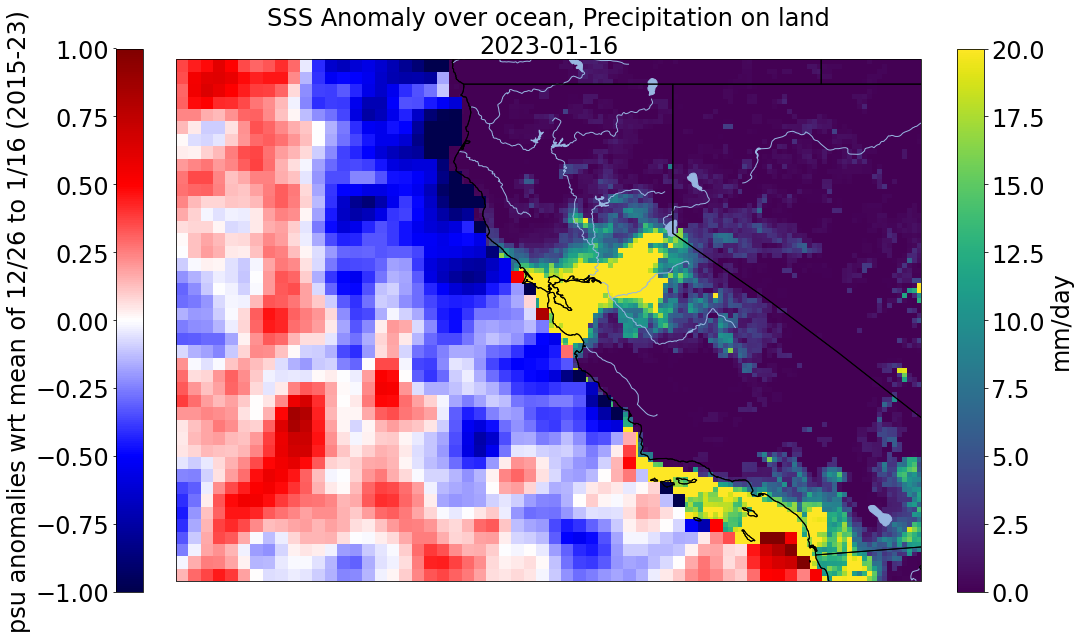
Uses python to plot the SMAP sea surface salinity anomalies over the ocean and the IMERG precipitation over the land.

Import needed packages

import glob
import numpy as np
import xarray as xr
import hvplot.xarray
import matplotlib.pyplot as plt
import cartopy.crs as ccrs
import cartopy.feature as cfeature
from datetime import datetime
import os
/opt/anaconda3/envs/plotting/lib/python3.9/site-packages/scipy/__init__.py:146: UserWarning: A NumPy version >=1.16.5 and <1.23.0 is required for this version of SciPy (detected version 1.23.1
  warnings.warn(f"A NumPy version >={np_minversion} and <{np_maxversion}"

Load directories

#Replace with your directory 
base_directory = "/Users/username" 

#Replace with your directory. This will be the output for plots
outputpath = (os.path.join(base_directory, 'Desktop/plots/'))

Open subset_location the SMAP SSS data for a specified subset

#the subset used to determine which values are plotted
subset_bounds = ['20221226', '20230116'] 

#calculates the mean over the same time period as the plotted values
subset_mean_bounds = subset_bounds 

#Replace with your directory of SMAP files
allsubset_files = xr.open_mfdataset(os.path.join(base_directory, 'Desktop/JPL_SMAP_L3/SMAP*.nc*'))


#grabs smap data from 12-26-2015 to 01-16-2023
allsubset_files = allsubset_files.sel(time=(allsubset_files['time'].dt.strftime('%m%d') >= subset_mean_bounds[0][4:8]) | (allsubset_files['time'].dt.strftime('%m%d') <= subset_mean_bounds[1][4:8]))
allsubset_files['time'].values
array(['2015-12-26T12:00:00.000000000', '2015-12-27T12:00:00.000000000',
       '2015-12-28T12:00:00.000000000', '2015-12-29T12:00:00.000000000',
       '2015-12-30T12:00:00.000000000', '2015-12-31T12:00:00.000000000',
       '2016-01-01T12:00:00.000000000', '2016-01-02T12:00:00.000000000',
       '2016-01-03T12:00:00.000000000', '2016-01-04T12:00:00.000000000',
       '2016-01-05T12:00:00.000000000', '2016-01-06T12:00:00.000000000',
       '2016-01-07T12:00:00.000000000', '2016-01-08T12:00:00.000000000',
       '2016-01-09T12:00:00.000000000', '2016-01-10T12:00:00.000000000',
       '2016-01-11T12:00:00.000000000', '2016-01-12T12:00:00.000000000',
       '2016-01-13T12:00:00.000000000', '2016-01-14T12:00:00.000000000',
       '2016-01-15T12:00:00.000000000', '2016-01-16T12:00:00.000000000',
       '2016-12-26T12:00:00.000000000', '2016-12-27T12:00:00.000000000',
       '2016-12-28T12:00:00.000000000', '2016-12-29T12:00:00.000000000',
       '2016-12-30T12:00:00.000000000', '2016-12-31T12:00:00.000000000',
       '2017-01-01T12:00:00.000000000', '2017-01-02T12:00:00.000000000',
       '2017-01-03T12:00:00.000000000', '2017-01-04T12:00:00.000000000',
       '2017-01-05T12:00:00.000000000', '2017-01-06T12:00:00.000000000',
       '2017-01-07T12:00:00.000000000', '2017-01-08T12:00:00.000000000',
       '2017-01-09T12:00:00.000000000', '2017-01-10T12:00:00.000000000',
       '2017-01-11T12:00:00.000000000', '2017-01-12T12:00:00.000000000',
       '2017-01-13T12:00:00.000000000', '2017-01-14T12:00:00.000000000',
       '2017-01-15T12:00:00.000000000', '2017-01-16T12:00:00.000000000',
       '2017-12-26T12:00:00.000000000', '2017-12-27T12:00:00.000000000',
       '2017-12-28T12:00:00.000000000', '2017-12-29T12:00:00.000000000',
       '2017-12-30T12:00:00.000000000', '2017-12-31T12:00:00.000000000',
       '2018-01-01T12:00:00.000000000', '2018-01-02T12:00:00.000000000',
       '2018-01-03T12:00:00.000000000', '2018-01-04T12:00:00.000000000',
       '2018-01-05T12:00:00.000000000', '2018-01-06T12:00:00.000000000',
       '2018-01-07T12:00:00.000000000', '2018-01-08T12:00:00.000000000',
       '2018-01-09T12:00:00.000000000', '2018-01-10T12:00:00.000000000',
       '2018-01-11T12:00:00.000000000', '2018-01-12T12:00:00.000000000',
       '2018-01-13T12:00:00.000000000', '2018-01-14T12:00:00.000000000',
       '2018-01-15T12:00:00.000000000', '2018-01-16T12:00:00.000000000',
       '2018-12-26T12:00:00.000000000', '2018-12-27T12:00:00.000000000',
       '2018-12-28T12:00:00.000000000', '2018-12-29T12:00:00.000000000',
       '2018-12-30T12:00:00.000000000', '2018-12-31T12:00:00.000000000',
       '2019-01-01T12:00:00.000000000', '2019-01-02T12:00:00.000000000',
       '2019-01-03T12:00:00.000000000', '2019-01-04T12:00:00.000000000',
       '2019-01-05T12:00:00.000000000', '2019-01-06T12:00:00.000000000',
       '2019-01-07T12:00:00.000000000', '2019-01-08T12:00:00.000000000',
       '2019-01-09T12:00:00.000000000', '2019-01-10T12:00:00.000000000',
       '2019-01-11T12:00:00.000000000', '2019-01-12T12:00:00.000000000',
       '2019-01-13T12:00:00.000000000', '2019-01-14T12:00:00.000000000',
       '2019-01-15T12:00:00.000000000', '2019-01-16T12:00:00.000000000',
       '2019-12-26T12:00:00.000000000', '2019-12-27T12:00:00.000000000',
       '2019-12-28T12:00:00.000000000', '2019-12-29T12:00:00.000000000',
       '2019-12-30T12:00:00.000000000', '2019-12-31T12:00:00.000000000',
       '2020-01-01T12:00:00.000000000', '2020-01-02T12:00:00.000000000',
       '2020-01-03T12:00:00.000000000', '2020-01-04T12:00:00.000000000',
       '2020-01-05T12:00:00.000000000', '2020-01-06T12:00:00.000000000',
       '2020-01-07T12:00:00.000000000', '2020-01-08T12:00:00.000000000',
       '2020-01-09T12:00:00.000000000', '2020-01-10T12:00:00.000000000',
       '2020-01-11T12:00:00.000000000', '2020-01-12T12:00:00.000000000',
       '2020-01-13T12:00:00.000000000', '2020-01-14T12:00:00.000000000',
       '2020-01-15T12:00:00.000000000', '2020-01-16T12:00:00.000000000',
       '2020-12-26T12:00:00.000000000', '2020-12-27T12:00:00.000000000',
       '2020-12-28T12:00:00.000000000', '2020-12-29T12:00:00.000000000',
       '2020-12-30T12:00:00.000000000', '2020-12-31T12:00:00.000000000',
       '2021-01-01T12:00:00.000000000', '2021-01-02T12:00:00.000000000',
       '2021-01-03T12:00:00.000000000', '2021-01-04T12:00:00.000000000',
       '2021-01-05T12:00:00.000000000', '2021-01-06T12:00:00.000000000',
       '2021-01-07T12:00:00.000000000', '2021-01-08T12:00:00.000000000',
       '2021-01-09T12:00:00.000000000', '2021-01-10T12:00:00.000000000',
       '2021-01-11T12:00:00.000000000', '2021-01-12T12:00:00.000000000',
       '2021-01-13T12:00:00.000000000', '2021-01-14T12:00:00.000000000',
       '2021-01-15T12:00:00.000000000', '2021-01-16T12:00:00.000000000',
       '2021-12-26T12:00:00.000000000', '2021-12-27T12:00:00.000000000',
       '2021-12-28T12:00:00.000000000', '2021-12-29T12:00:00.000000000',
       '2021-12-30T12:00:00.000000000', '2021-12-31T12:00:00.000000000',
       '2022-01-01T12:00:00.000000000', '2022-01-02T12:00:00.000000000',
       '2022-01-03T12:00:00.000000000', '2022-01-04T12:00:00.000000000',
       '2022-01-05T12:00:00.000000000', '2022-01-06T12:00:00.000000000',
       '2022-01-07T12:00:00.000000000', '2022-01-08T12:00:00.000000000',
       '2022-01-09T12:00:00.000000000', '2022-01-10T12:00:00.000000000',
       '2022-01-11T12:00:00.000000000', '2022-01-12T12:00:00.000000000',
       '2022-01-13T12:00:00.000000000', '2022-01-14T12:00:00.000000000',
       '2022-01-15T12:00:00.000000000', '2022-01-16T12:00:00.000000000',
       '2022-12-26T12:00:00.000000000', '2022-12-27T12:00:00.000000000',
       '2022-12-28T12:00:00.000000000', '2022-12-29T12:00:00.000000000',
       '2022-12-30T12:00:00.000000000', '2022-12-31T12:00:00.000000000',
       '2023-01-01T12:00:00.000000000', '2023-01-02T12:00:00.000000000',
       '2023-01-03T12:00:00.000000000', '2023-01-04T12:00:00.000000000',
       '2023-01-05T12:00:00.000000000', '2023-01-06T12:00:00.000000000',
       '2023-01-07T12:00:00.000000000', '2023-01-08T12:00:00.000000000',
       '2023-01-09T12:00:00.000000000', '2023-01-10T12:00:00.000000000',
       '2023-01-11T12:00:00.000000000', '2023-01-12T12:00:00.000000000',
       '2023-01-13T12:00:00.000000000', '2023-01-14T12:00:00.000000000',
       '2023-01-15T12:00:00.000000000', '2023-01-16T12:00:00.000000000'],
      dtype='datetime64[ns]')

Calculates the mean

#subsets to the location of the pacific coast and California 
subset_location = allsubset_files.where((allsubset_files.latitude>20)&(allsubset_files.latitude<50)&(allsubset_files.longitude>-140)&(allsubset_files.longitude<-100), drop=True)

#calculates the mean for the 'smap_sss' variable
subset_mean_values = np.nanmean(subset_location['smap_sss'], axis=0)

#gets rid of past mean value if you were to run this code again with different dates
if 'backup_subset_mean_values' in globals():
    del backup_subset_mean_values
    
#plots the figure and saves it to your output path
fig = plt.figure(figsize= (16,10))
ax = fig.add_subplot(1, 1, 1, projection=ccrs.PlateCarree())
s = plt.pcolormesh(subset_location.longitude, subset_location.latitude, subset_mean_values, vmin =  33, vmax= 35, cmap = 'rainbow', transform = ccrs.PlateCarree())
cb = plt.colorbar(s)
cb.set_label('psu')
ax.set_title(f'SSS mean over 12/26 to 1/16 (2015-2023)', size = 24)
ax.grid()
ax.add_feature(cfeature.OCEAN)
ax.add_feature(cfeature.LAND)
ax.add_feature(cfeature.LAKES)
ax.add_feature(cfeature.RIVERS)
ax.add_feature(cfeature.STATES)
ax.coastlines()
ax.set_xlim(-130, -115)
ax.set_ylim(32, 42.5)

#saves figure to output path 
plt.savefig(outputpath+datetime.now().strftime("%Y%m%d-%H%M%S")+'.png',dpi=400, facecolor='w', transparent=False, bbox_inches='tight')
/var/folders/f0/dgnqgvtx46513by9cdh6fnjw0000gq/T/ipykernel_66947/1610522150.py:5: RuntimeWarning: Mean of empty slice
  subset_mean_values = np.nanmean(subset_location['smap_sss'], axis=0)

plot the anomalies for subset bounds

#Plots precip data only over land, using a colorscale
mode_choice = 2 

#currently, the line below is commented but you can uncomment this line and it will display raw SSS values (doesnt calculate anomalies) 
#calc_anomaly = 0 

#calculate anomalies relative to the mean
calc_anomaly = 1 

#Replace with your dictory for IMERG precip data
directory = os.path.join(base_directory, 'Desktop/imerg_precip')
if 'backup_subset_mean_values' not in globals():
    backup_subset_mean_values = subset_mean_values

#raw sss values
if calc_anomaly == 0:
    subset_mean_values = 0
    smin = 31
    smax = 34.5  
    smap = 'rainbow'

#anomaly values
if calc_anomaly != 0:
    subset_mean_values = backup_subset_mean_values 
    smin = -1
    smax = +1 
    smap = 'seismic'

#Replace with your directory 
sss_subset = sorted(glob.glob(os.path.join(base_directory, 'Desktop/jpl_smap_l3/SMAP*.nc*')))

#grabs the sss file date for the subset location and plots anomalies
for filename in sss_subset:
    file_date = filename.split('_')[-3].replace('.nc', '')
    updated_file_date = file_date[0:4]+'-'+file_date[4:6]+'-'+file_date[6:8]
    if int(file_date) < int(subset_bounds[0]) or int(file_date) > int(subset_bounds[1]):
        continue
    print(file_date)
    sss_ds = xr.open_dataset(filename)
    try:
        sss_ds = sss_ds.where((sss_ds.latitude>20)&(sss_ds.latitude<50)&(sss_ds.longitude>-140)&(sss_ds.longitude<-100), drop=True)- subset_mean_values
        if sss_ds.smap_sss.size == 0:
            continue
    except Exception as e:
        print(e)
        continue
    plt.rcParams.update({"font.size": 24})
    fig = plt.figure(figsize= (16,10))
    ax = fig.add_subplot(1, 1, 1, projection=ccrs.PlateCarree())

    #grabs the precip file date for the subset location and plots  
    substring = file_date
    precip_counter = 0
    for file_path in glob.glob(os.path.join(directory, f'*{substring}*')):
        precip_counter += 1
        if precip_counter >1:
            crashnow
        print(file_path)
        precip = xr.open_dataset(file_path)
        precip = precip.where((precip.lat>20)&(precip.lat<50)&(precip.lon>-140)&(precip.lon<-100),drop=True)
        val = 24*precip.HQprecipitation[0,:,:]/(0.5*precip.HQprecipitation_cnt[0,:,:])
        if mode_choice == 2: 
            p = plt.pcolormesh(precip.lon,precip.lat,val.transpose(), cmap = 'viridis', vmax = 20, vmin = 0, transform = ccrs.PlateCarree())
        cb = plt.colorbar(p, fraction=0.046, pad=0.04)
        cb.set_label('mm/day')

    #the line below plots the raw sss values if its uncommented
    s = plt.pcolormesh(sss_ds.longitude, sss_ds.latitude, sss_ds.smap_sss, vmin = smin, vmax = smax, cmap = smap, transform = ccrs.PlateCarree())
    
    #adds the colorbar and features to the plot
    cb = plt.colorbar(s, location = 'left', fraction=0.046, pad=0.04)
    if calc_anomaly == 1:
        cb.set_label(f'psu anomalies wrt mean of 12/26 to 1/16 (2015-23)')
        ax.set_title(f'SSS Anomaly over ocean, Precipitation on land\n{updated_file_date}', size = 24)
    if calc_anomaly != 1:
        cb.set_label('psu')
        ax.set_title(f'SSS over ocean, Precipitation on land\n{updated_file_date}', size = 24)
    ax.grid()
    ax.add_feature(cfeature.OCEAN)
    ax.add_feature(cfeature.LAND)
    ax.add_feature(cfeature.LAKES)
    ax.add_feature(cfeature.RIVERS)
    ax.add_feature(cfeature.STATES)
    ax.coastlines()
    ax.set_xlim(-130, -115)
    ax.set_ylim(32, 42.5)

    #saves figure to output path 
    plt.savefig(outputpath+datetime.now().strftime("%Y%m%d-%H%M%S")+'.png',dpi=400, facecolor='w', transparent=False, bbox_inches='tight')
/var/folders/f0/dgnqgvtx46513by9cdh6fnjw0000gq/T/ipykernel_66947/576375500.py:48: RuntimeWarning: More than 20 figures have been opened. Figures created through the pyplot interface (`matplotlib.pyplot.figure`) are retained until explicitly closed and may consume too much memory. (To control this warning, see the rcParam `figure.max_open_warning`).
  fig = plt.figure(figsize= (16,10))