Earthdata GIS SWOT Rivers Feature Service Access
Authored by Nicholas Tarpinian, PO.DAAC
Versions used: ArcGIS Pro 3.3.1, QGIS 3.42.3
Summary
The following instructions describe how to connect to Earthdata GIS (EGIS) endpoints with various Geographical Information System (GIS) Desktop softwares. This guide shows how to connect to the recently released Surface Water and Ocean Topography (SWOT) Feature Service of the SWOT_L2_HR_RiverSP_D River Reach collection.
For more details on these services and the latest available services, please visit the EGIS SWOT Feature Service page:
SWOT_L2_HR_RiverSP_reach_vD_BASIC
Learning Objectives:
- Connecting to the SWOT Rivers Feature Service through the Map Viewer, ArcGIS Pro, or QGIS.
- Exploring the collection through time.
- Creating a time series plot.
- Updating the symbology based on its unique variables SWOT offers.
- Cleaning up values to mask fill values.
Map Viewer
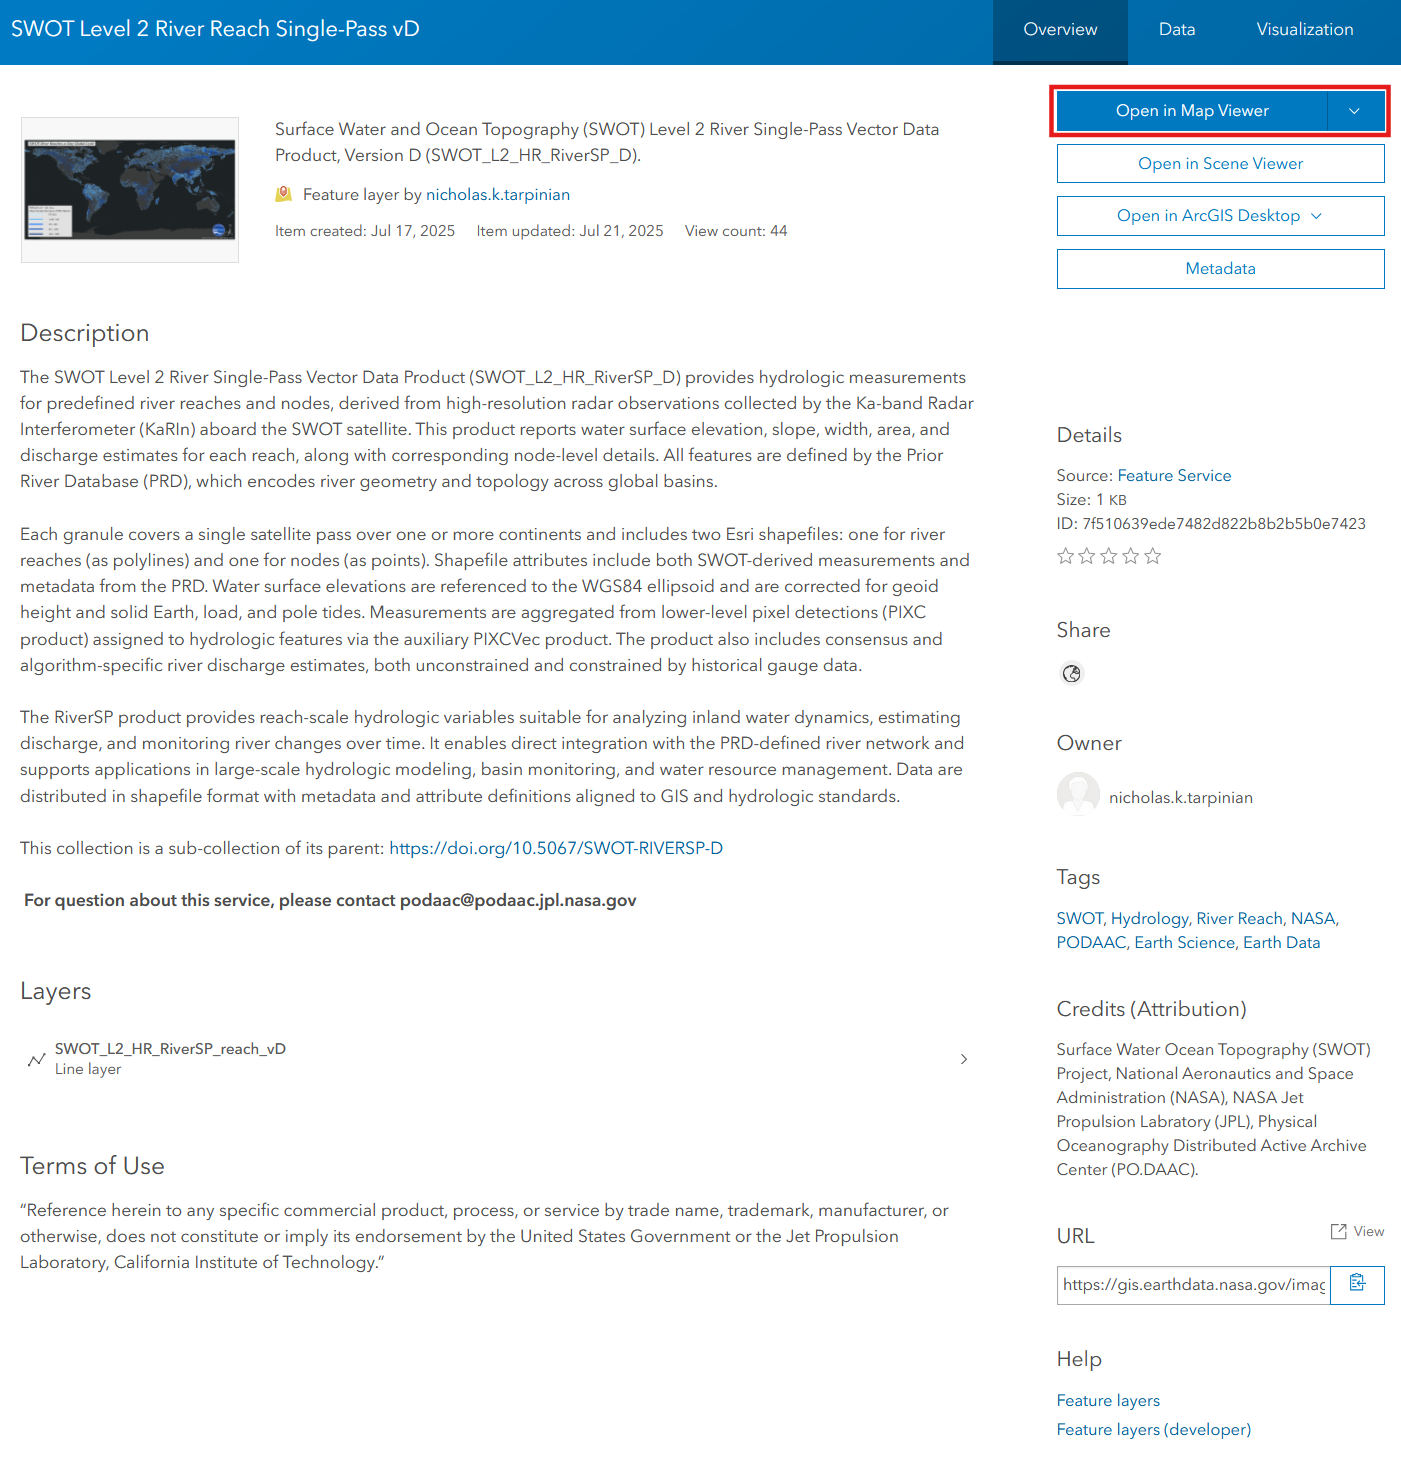
You can quickly view the SWOT Feature Service through the dataset landing page by selecting Open in Map Viewer.
Once open you can expand the time scale to view the observed reaches available.
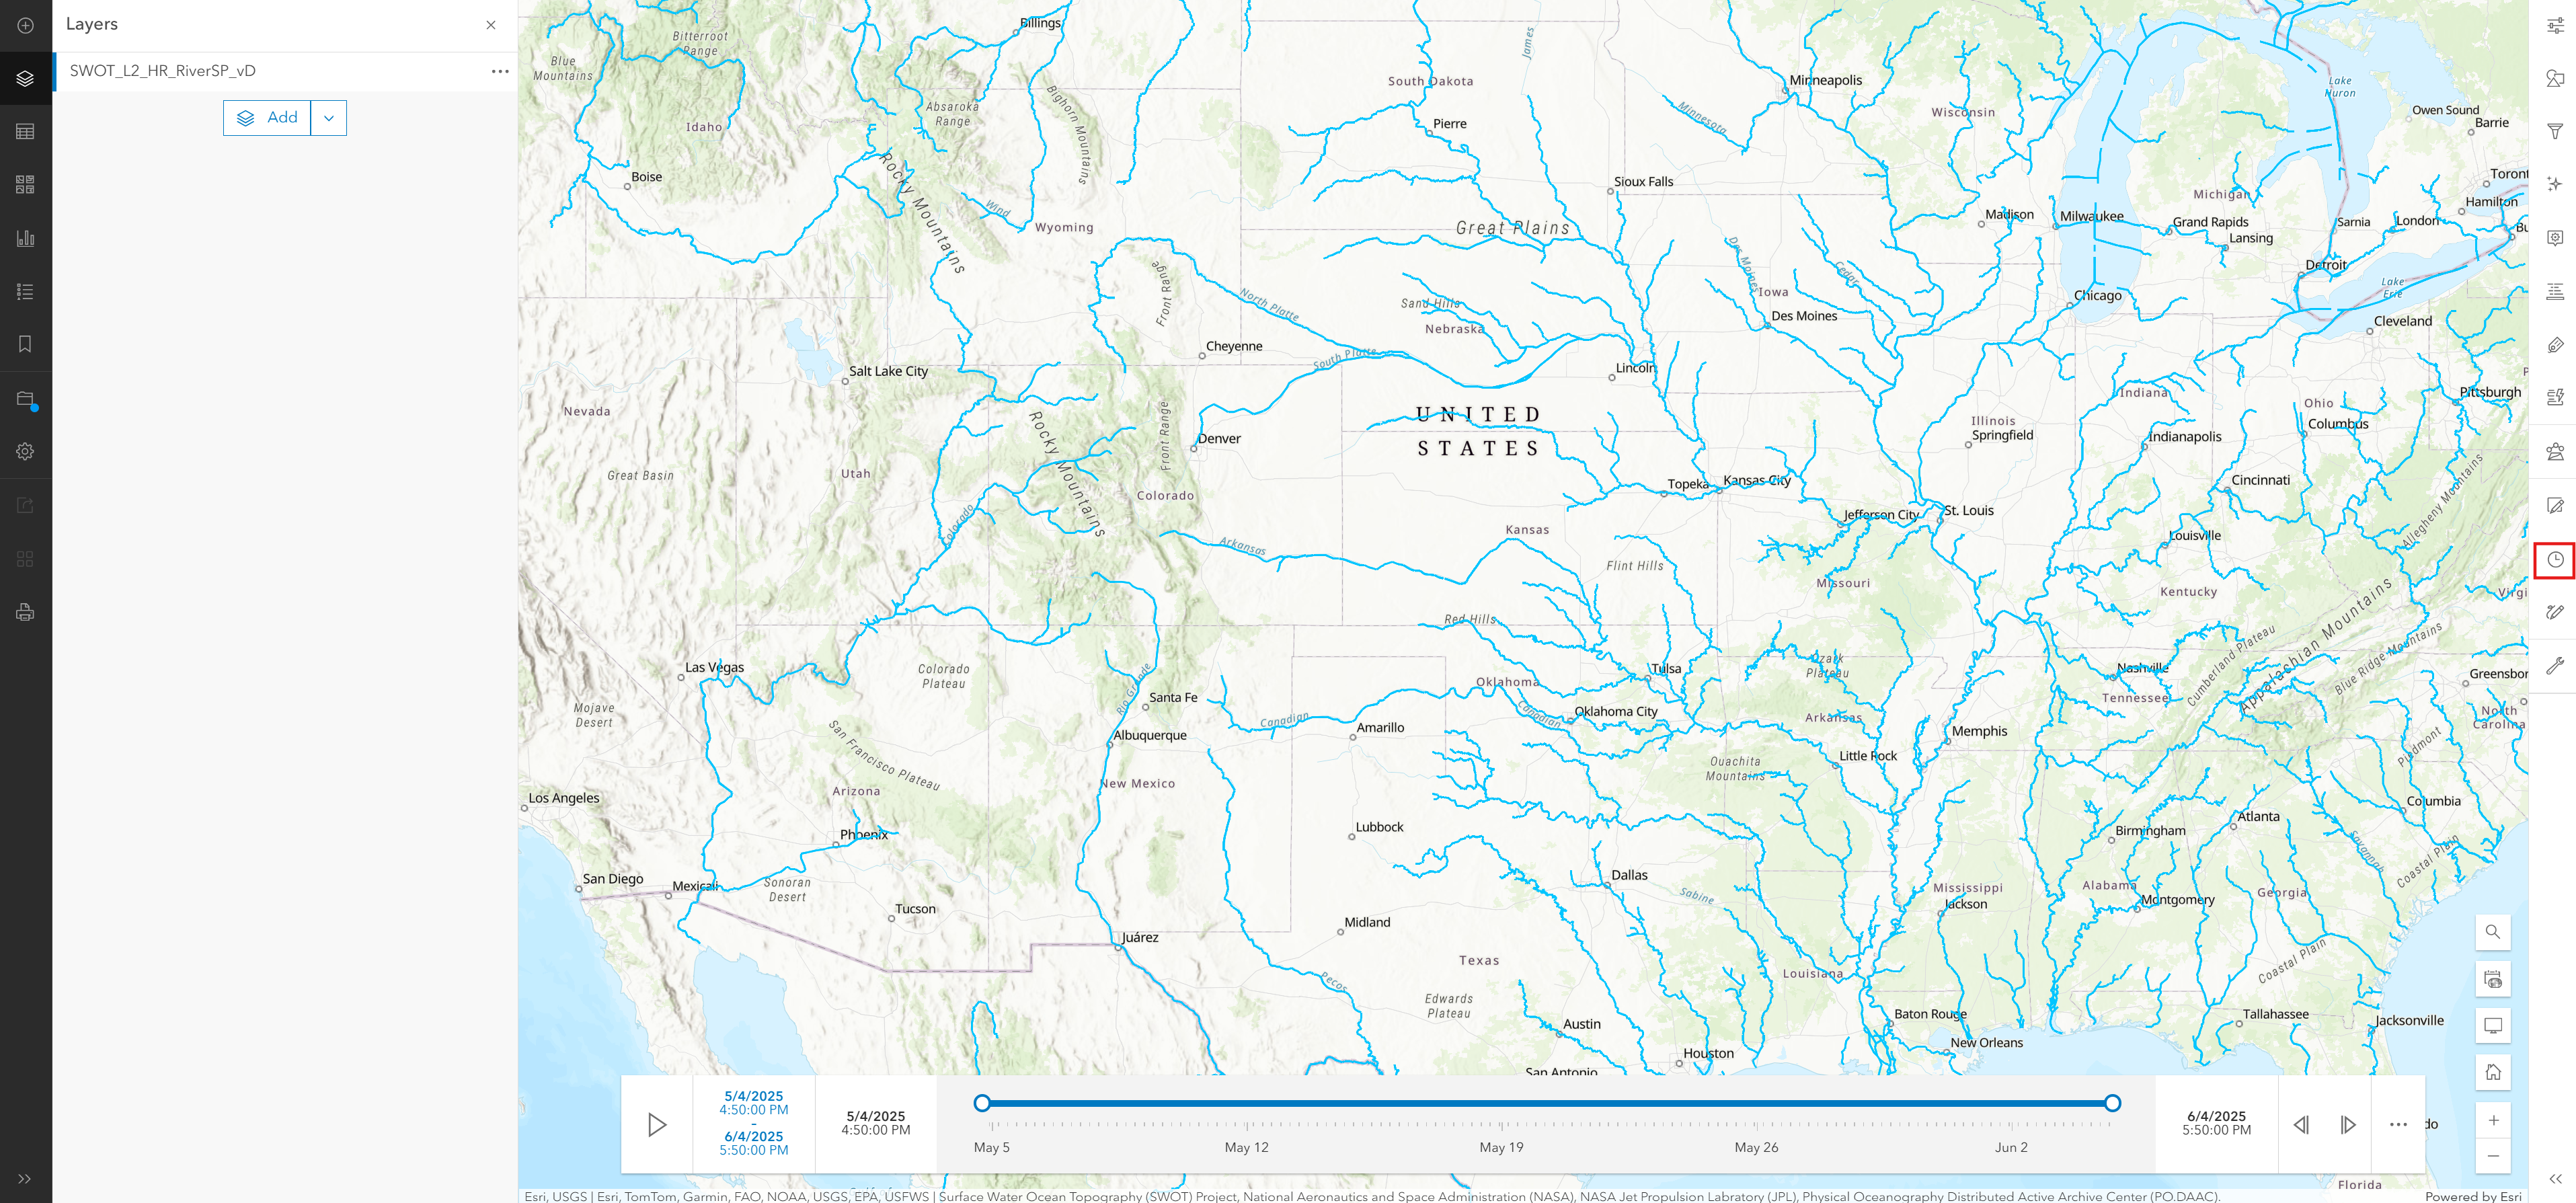
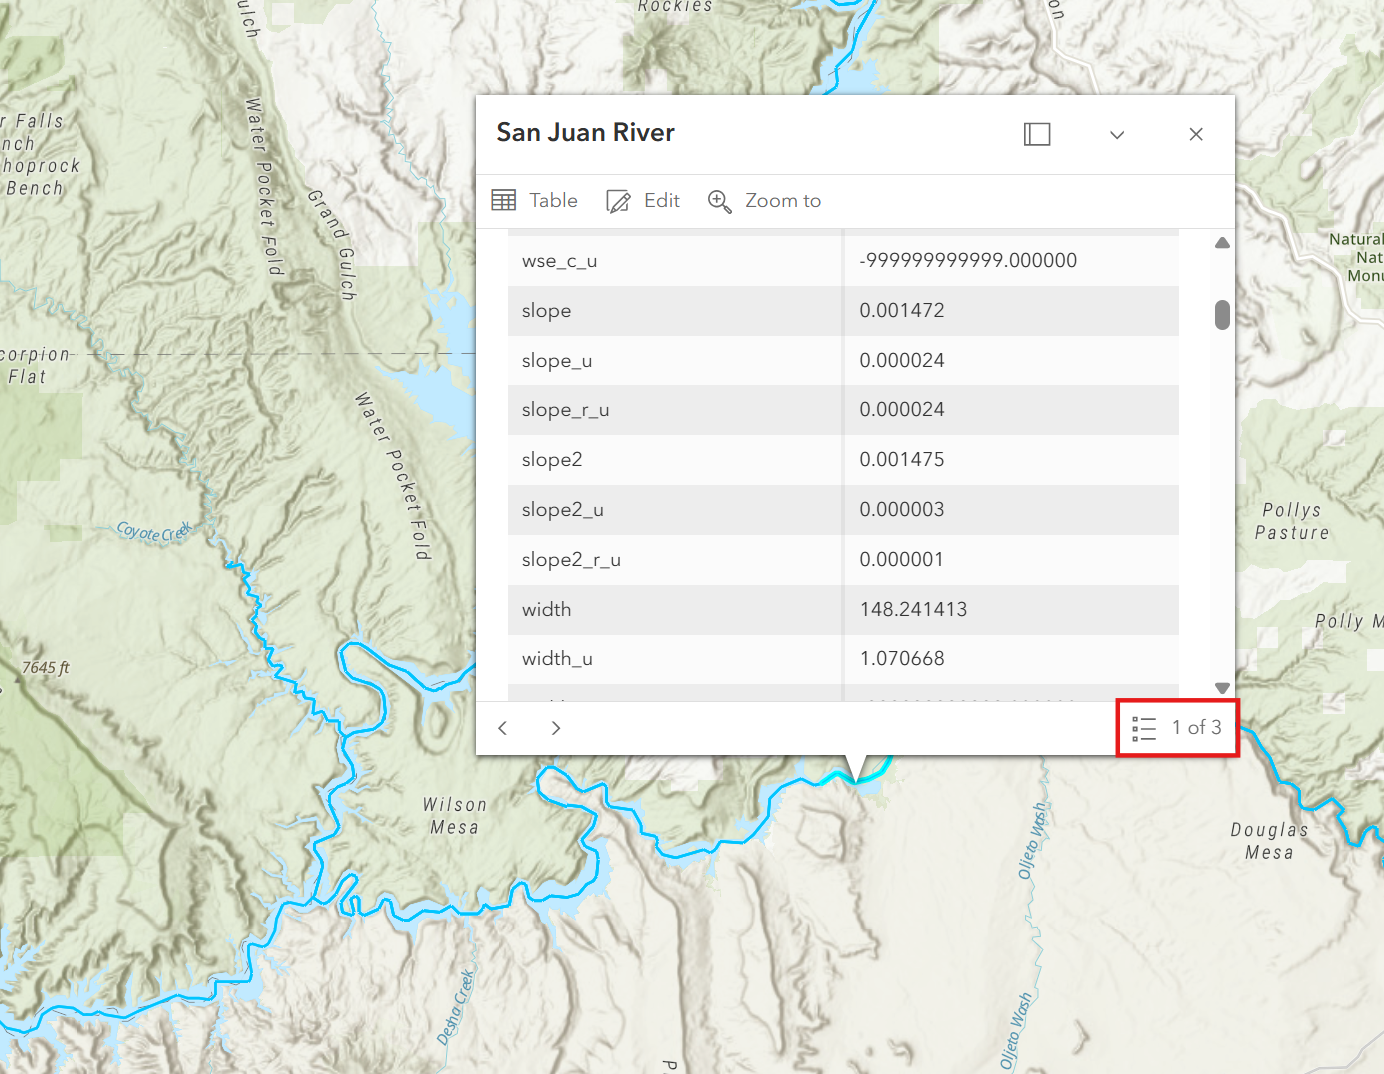
Zooming in, you can select a river reach by clicking on it, which will pop up the reaches attributes with the latest observations. In the corner of the pop-up, it will highlight the record amount SWOT has observed for that specific river reach.
ArcGIS Pro
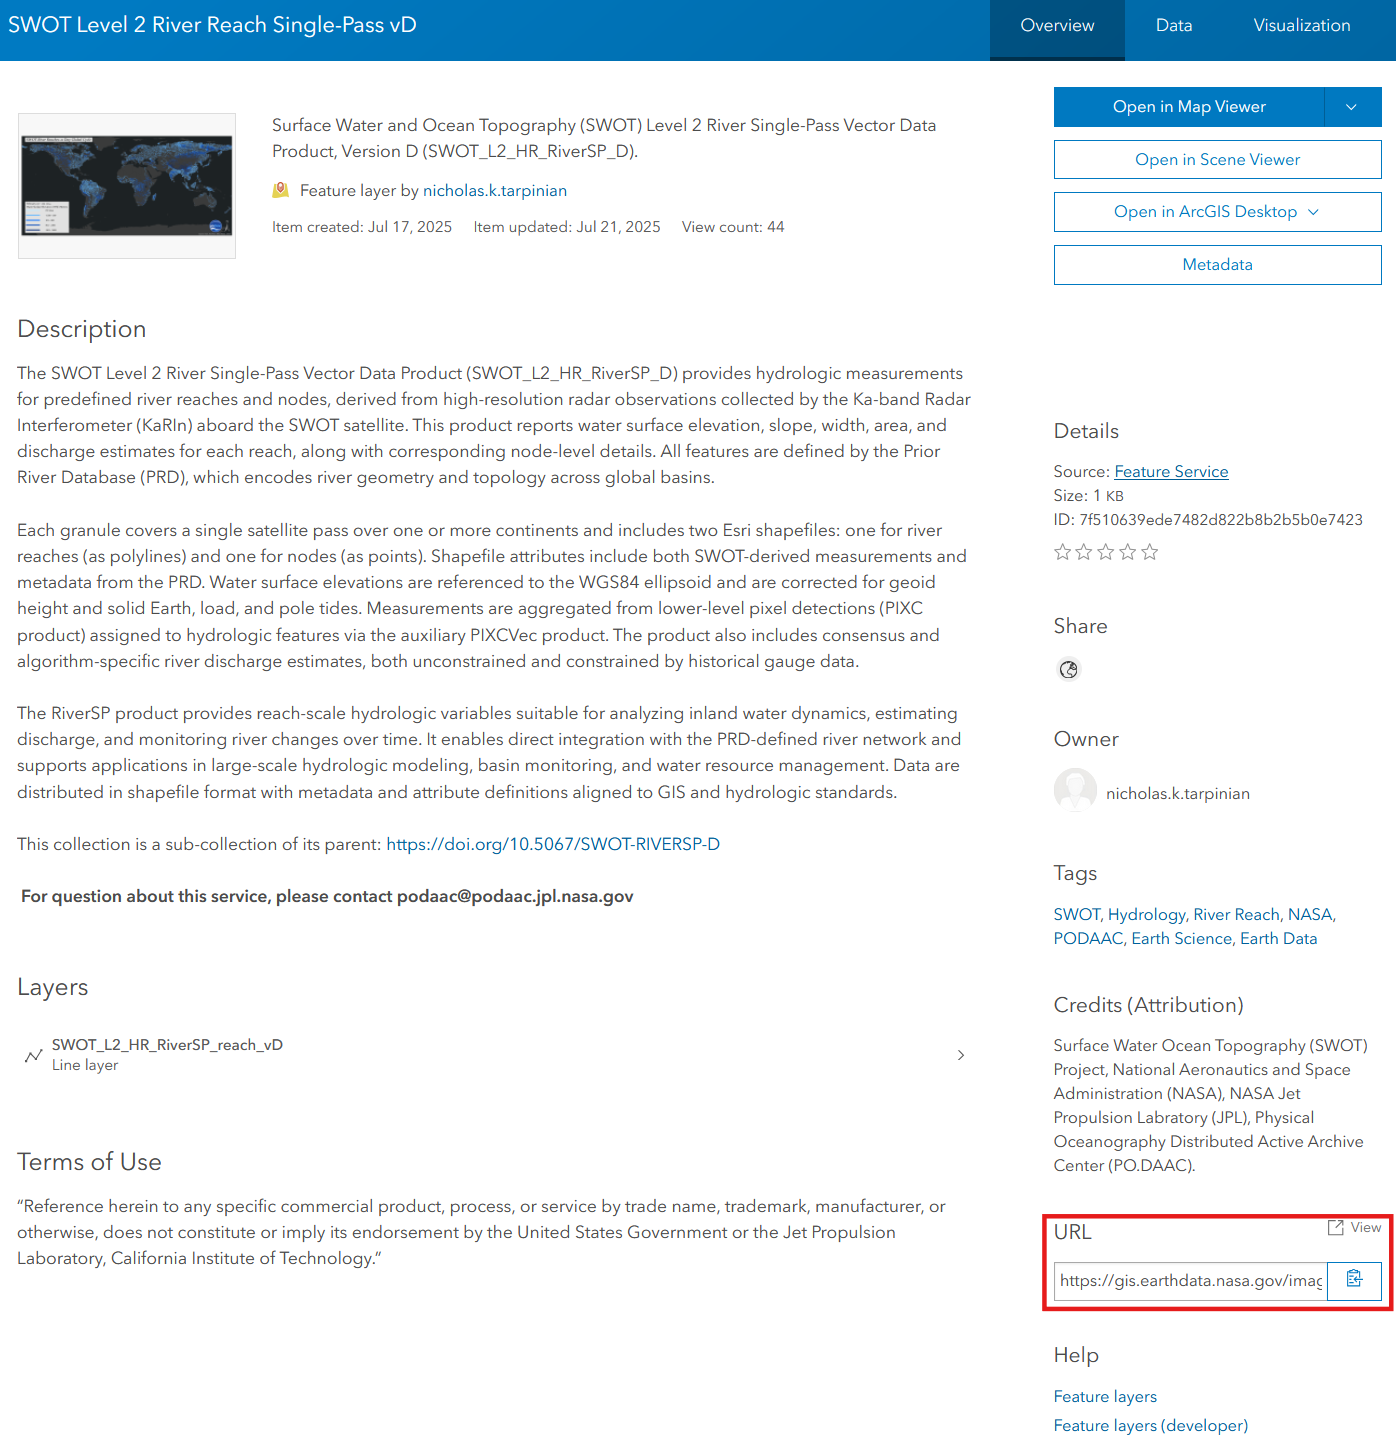
To connect to the Feature Servicein ArcGIS Pro, first grab the endpoint URL: https://gis.earthdata.nasa.gov/image/rest/services/C3233944997_POCLOUD/SWOT_L2_HR_RiverSP_reach_vD/FeatureServer from the dataset landing page as shown in the image below:
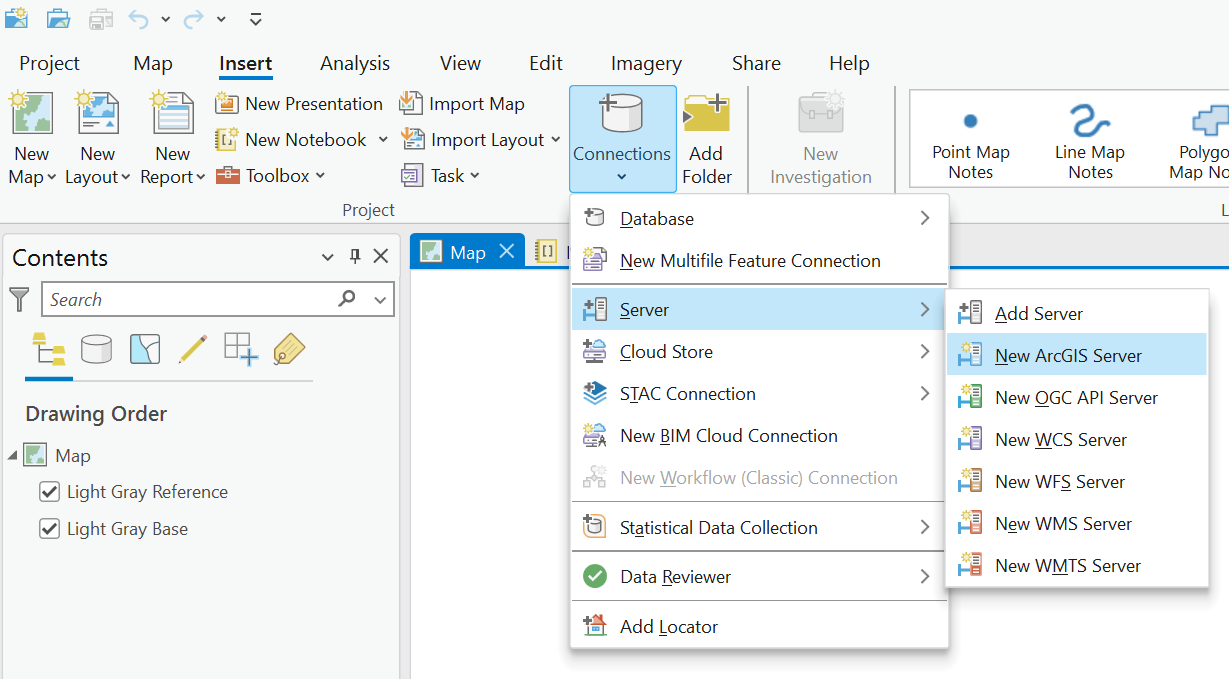
Next step is to open ArcGIS Pro and select the Connections tab.
Then within the Server section you have the option of connecting a New ArcGIS Server.
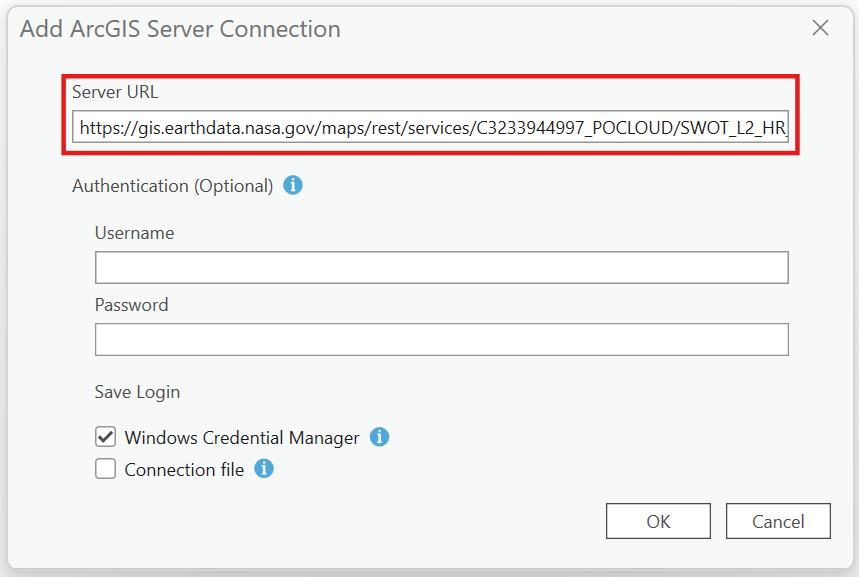
Then enter the Feature Service endpoint within the Server URL.
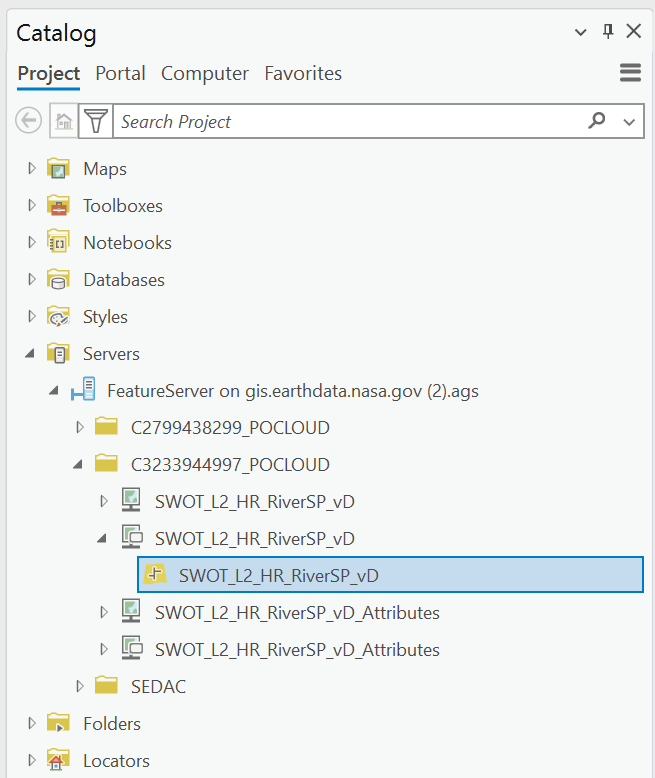
Once a connection is established, go to the Catalog pane, and under Servers you will find the Feature Service where it can be added to the map.
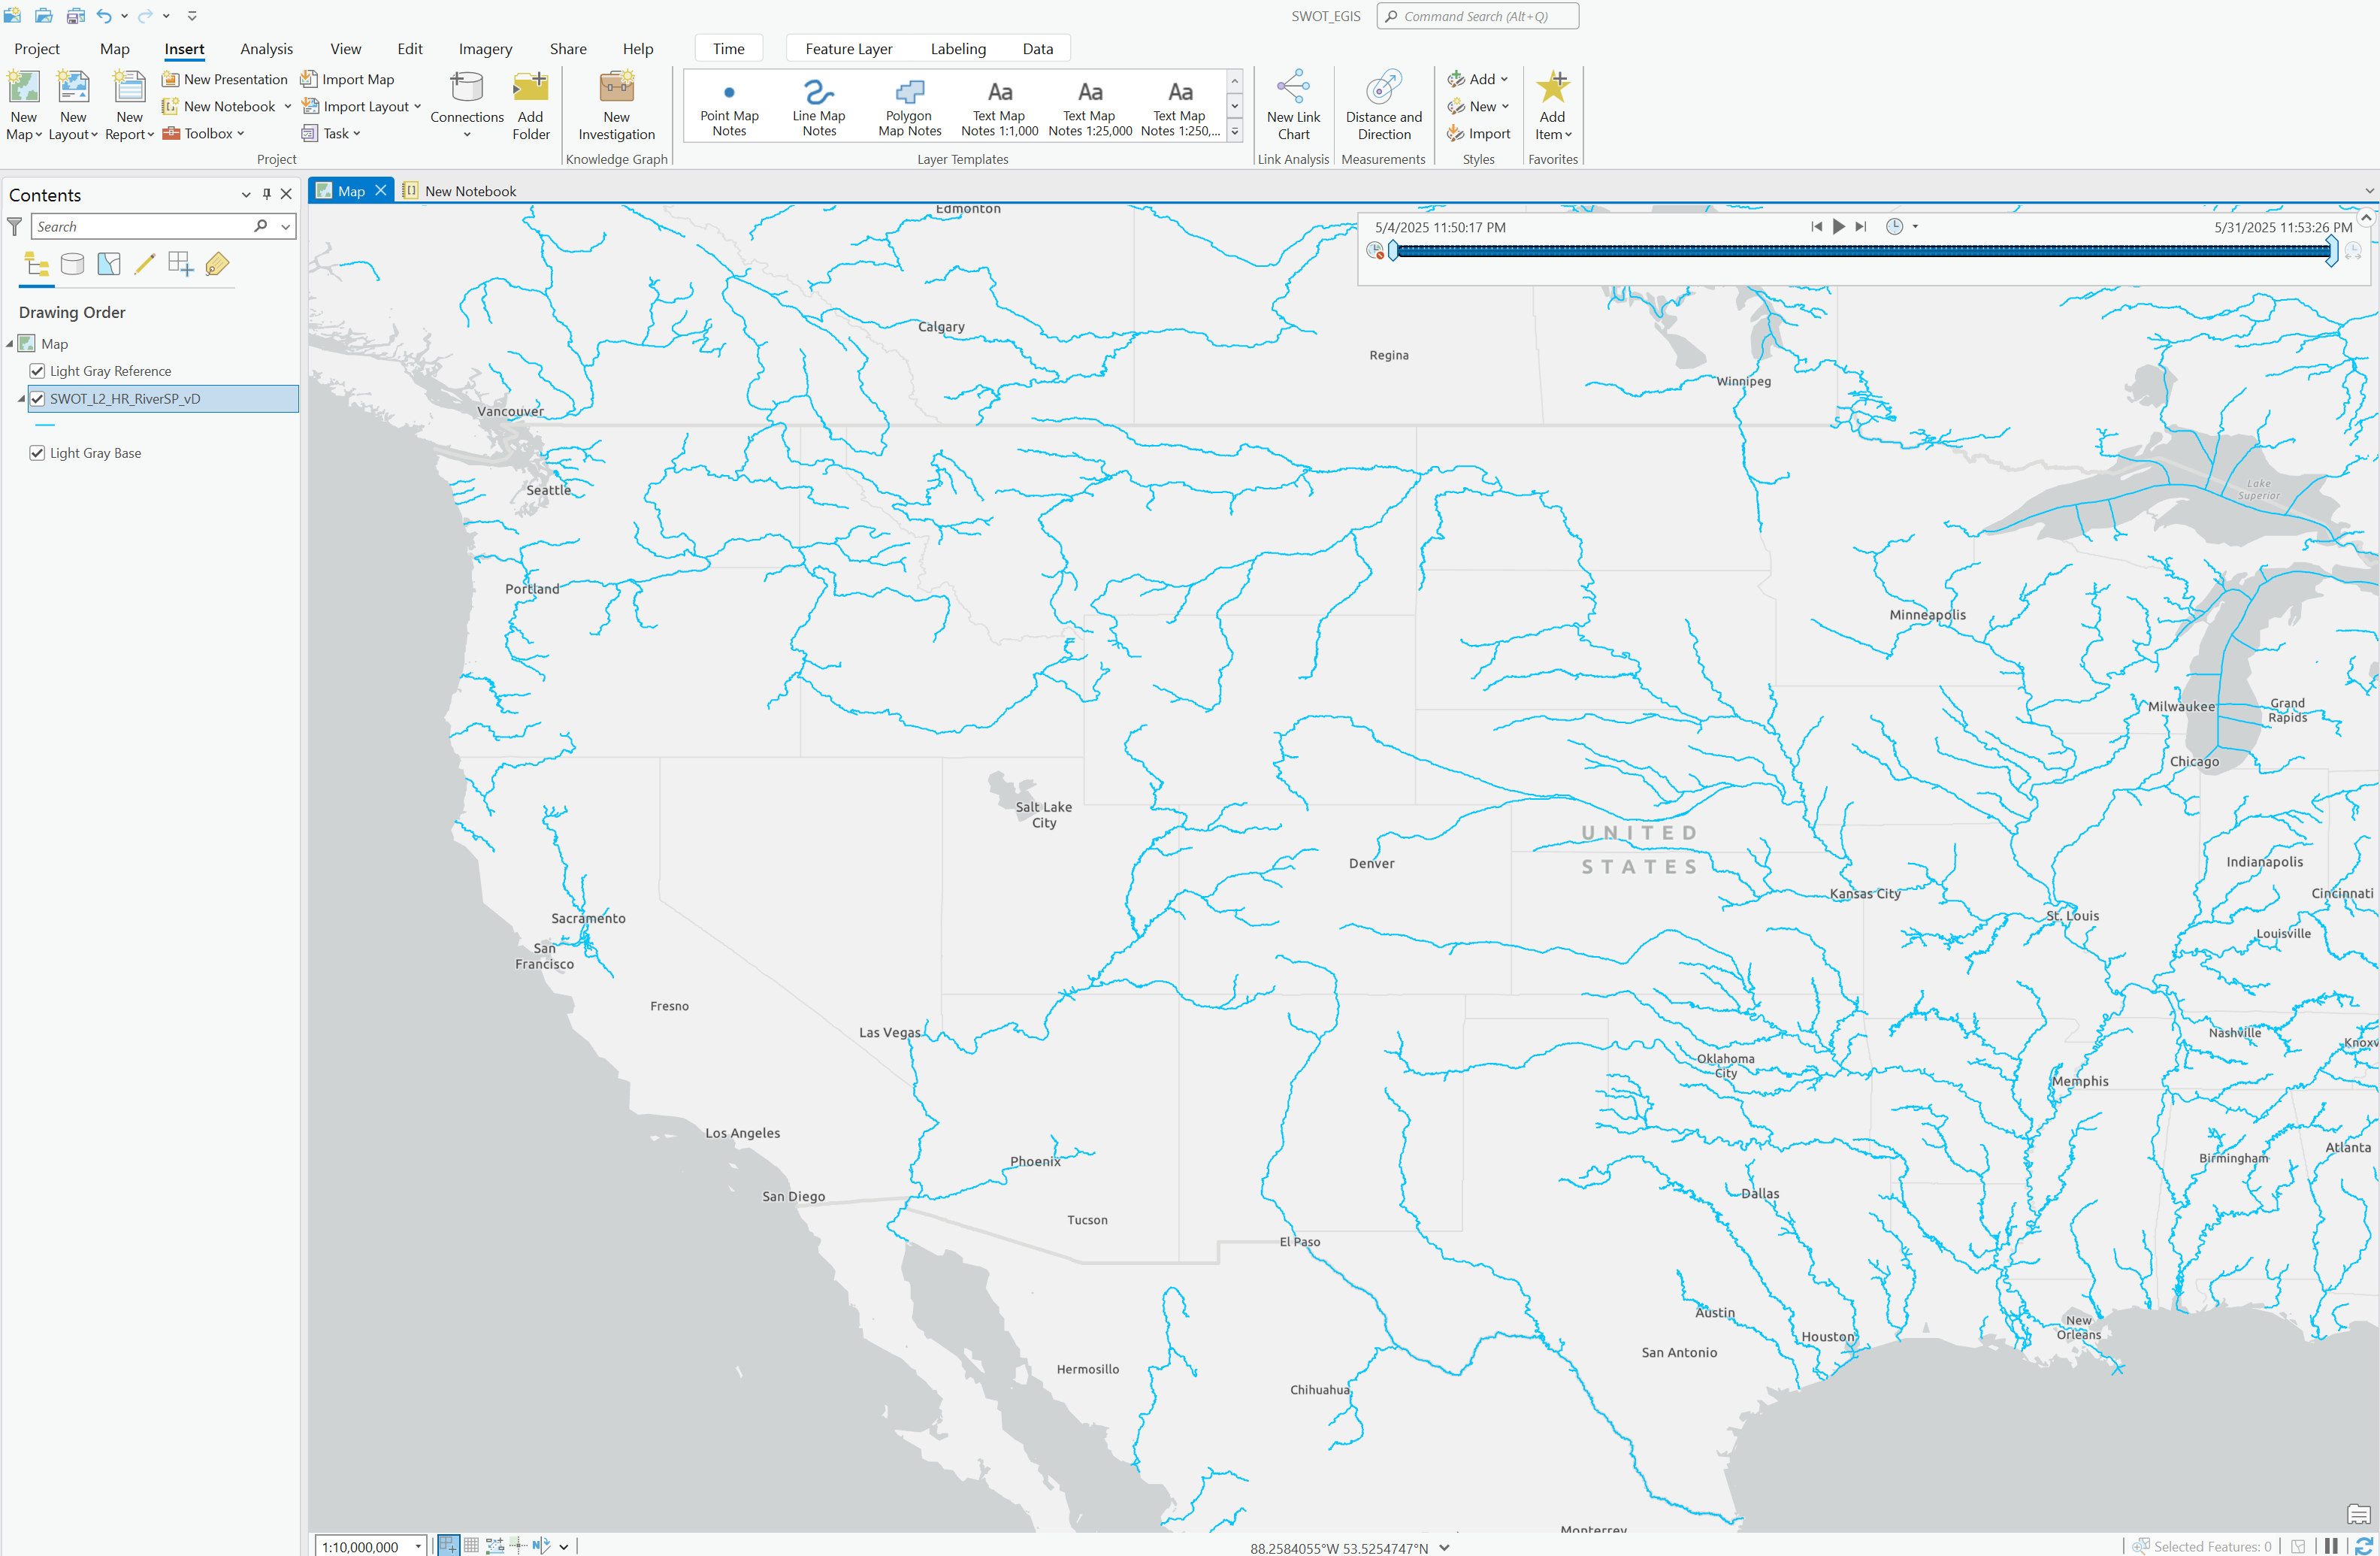
The SWOT_L2_HR_RiverSP_reach_vD is best observed with a reduced time scale (e.g. using the time slider). River Reach (segments) data will be visible at a zoom level extent between 1:5,000 - 1:10,000,000.
Please note: If querying via Select By Attributes, certain queries may timeout depending on the attribute/variable used due to the amount of records.
QGIS
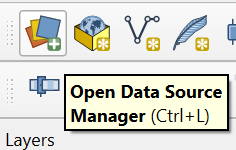
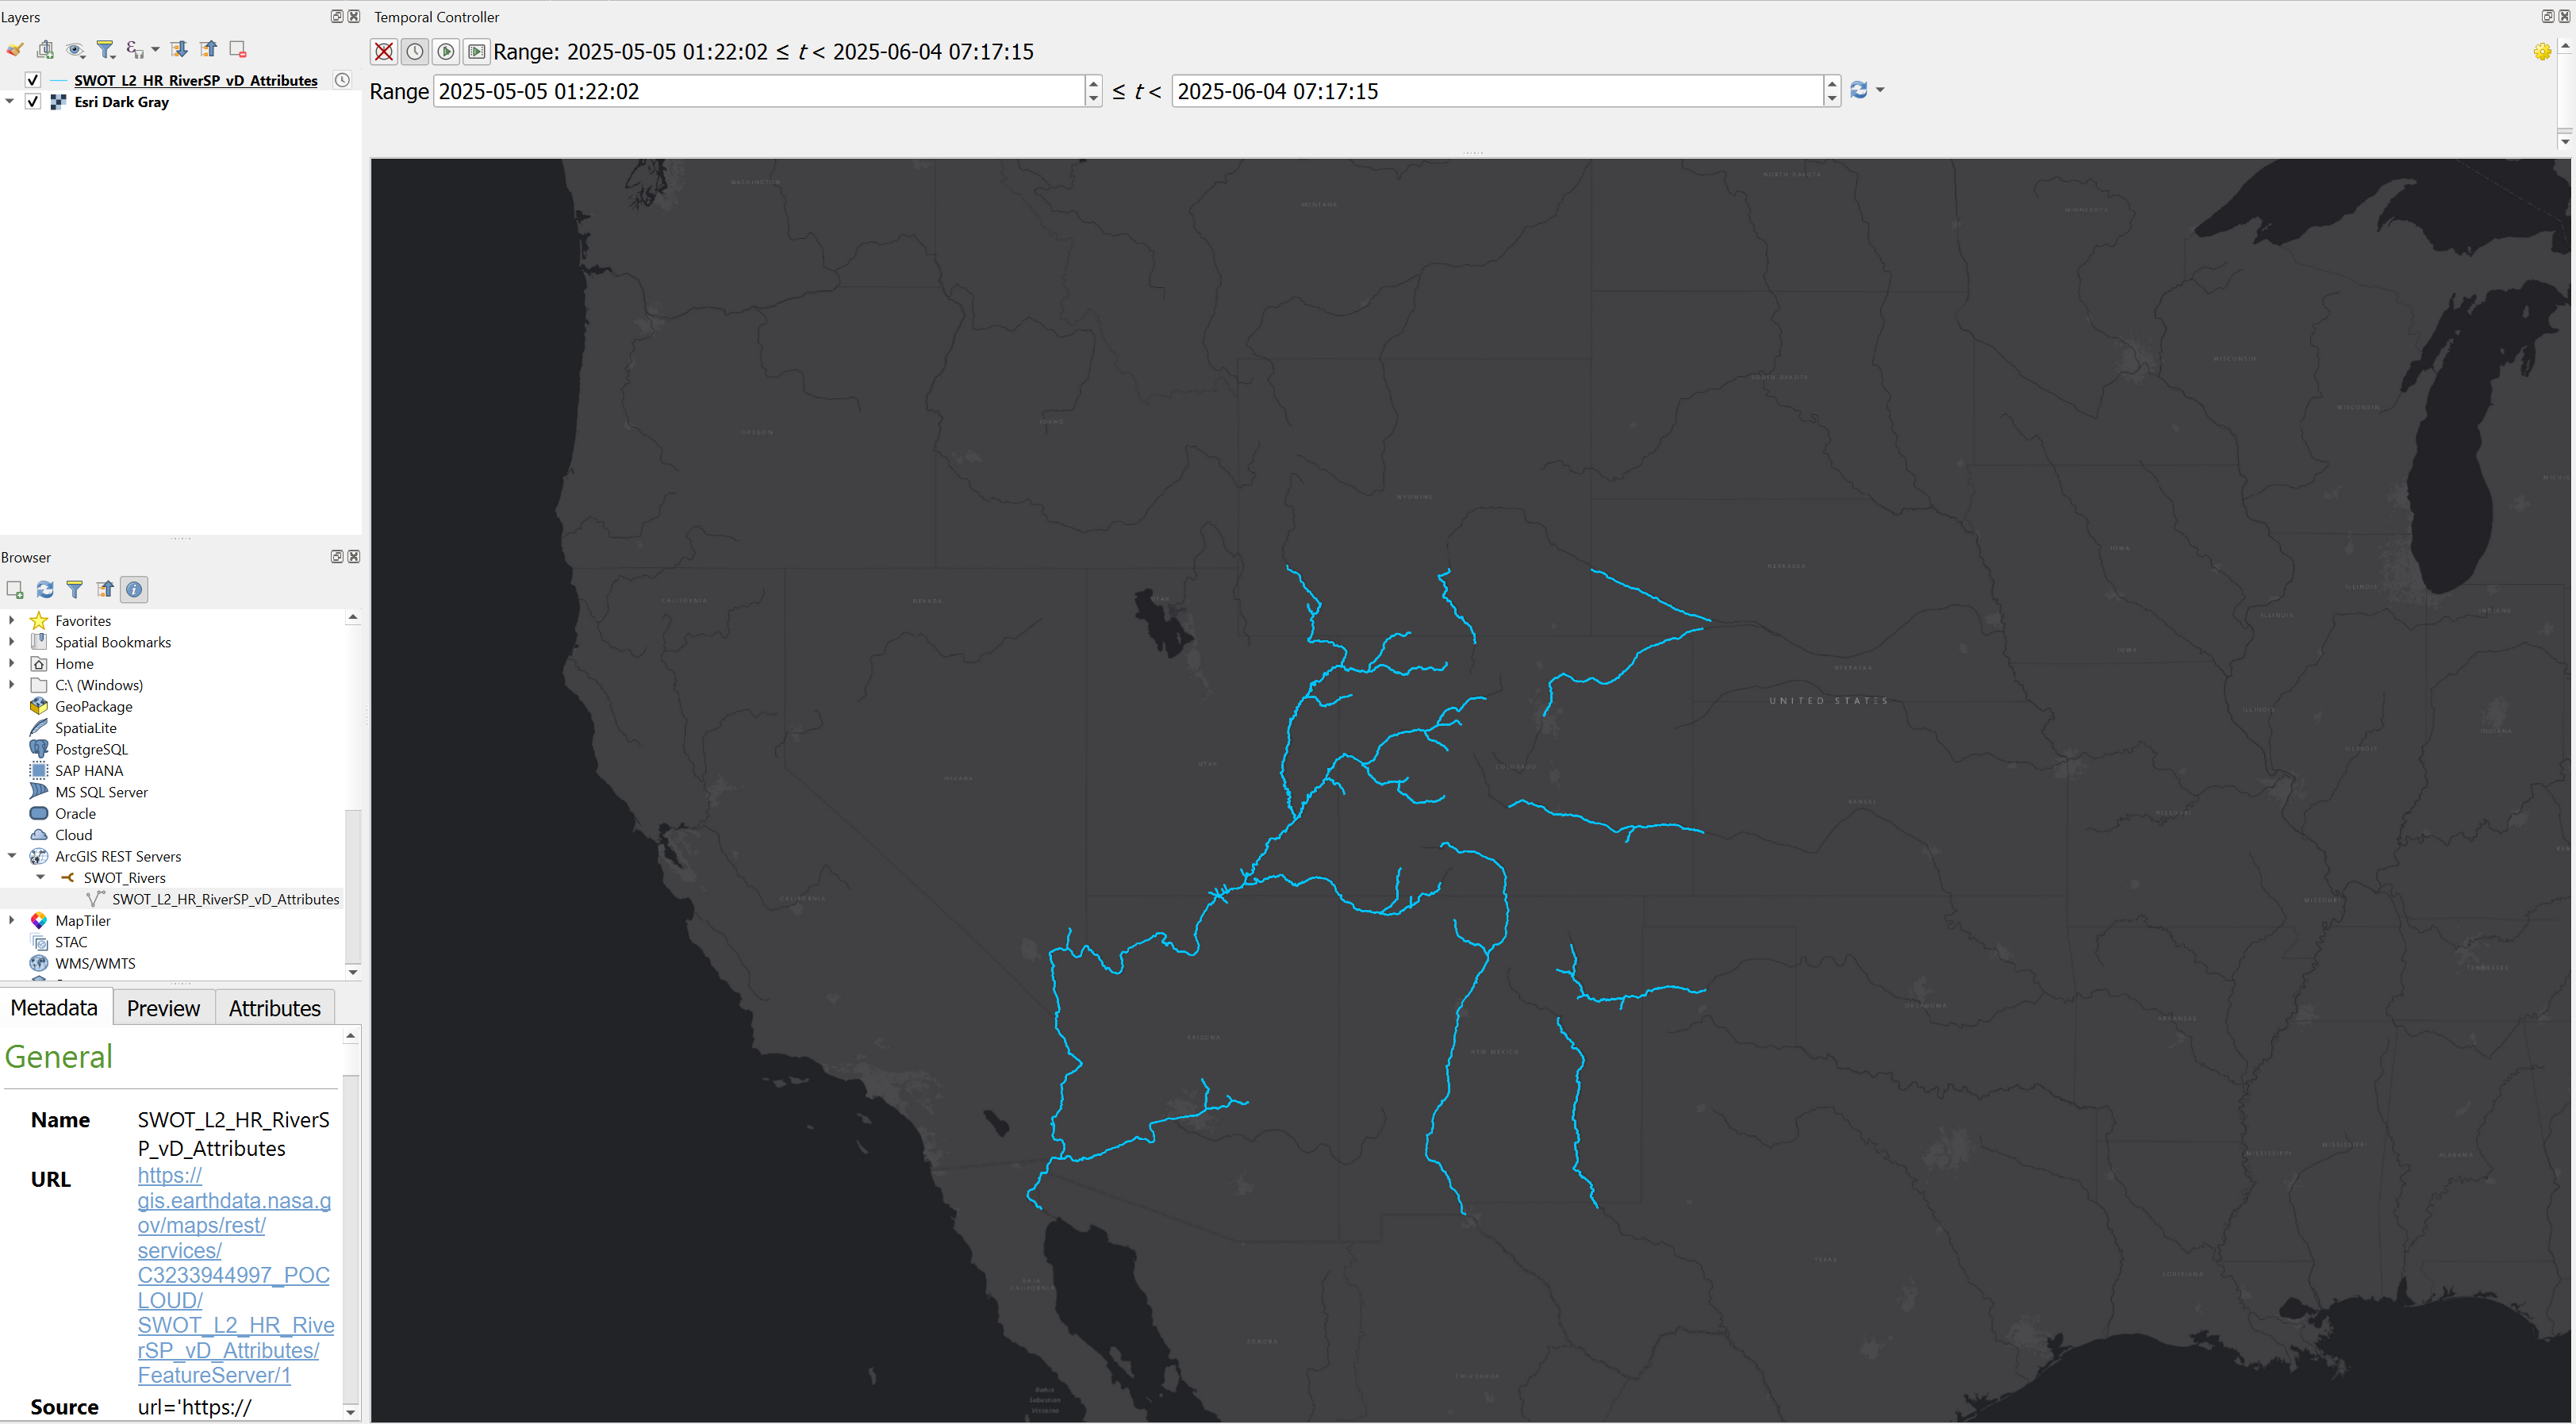
The same Feature Service endpoint can also be connected to QGIS. Grabbing that endpoint, go to the Data Source Manager tab.
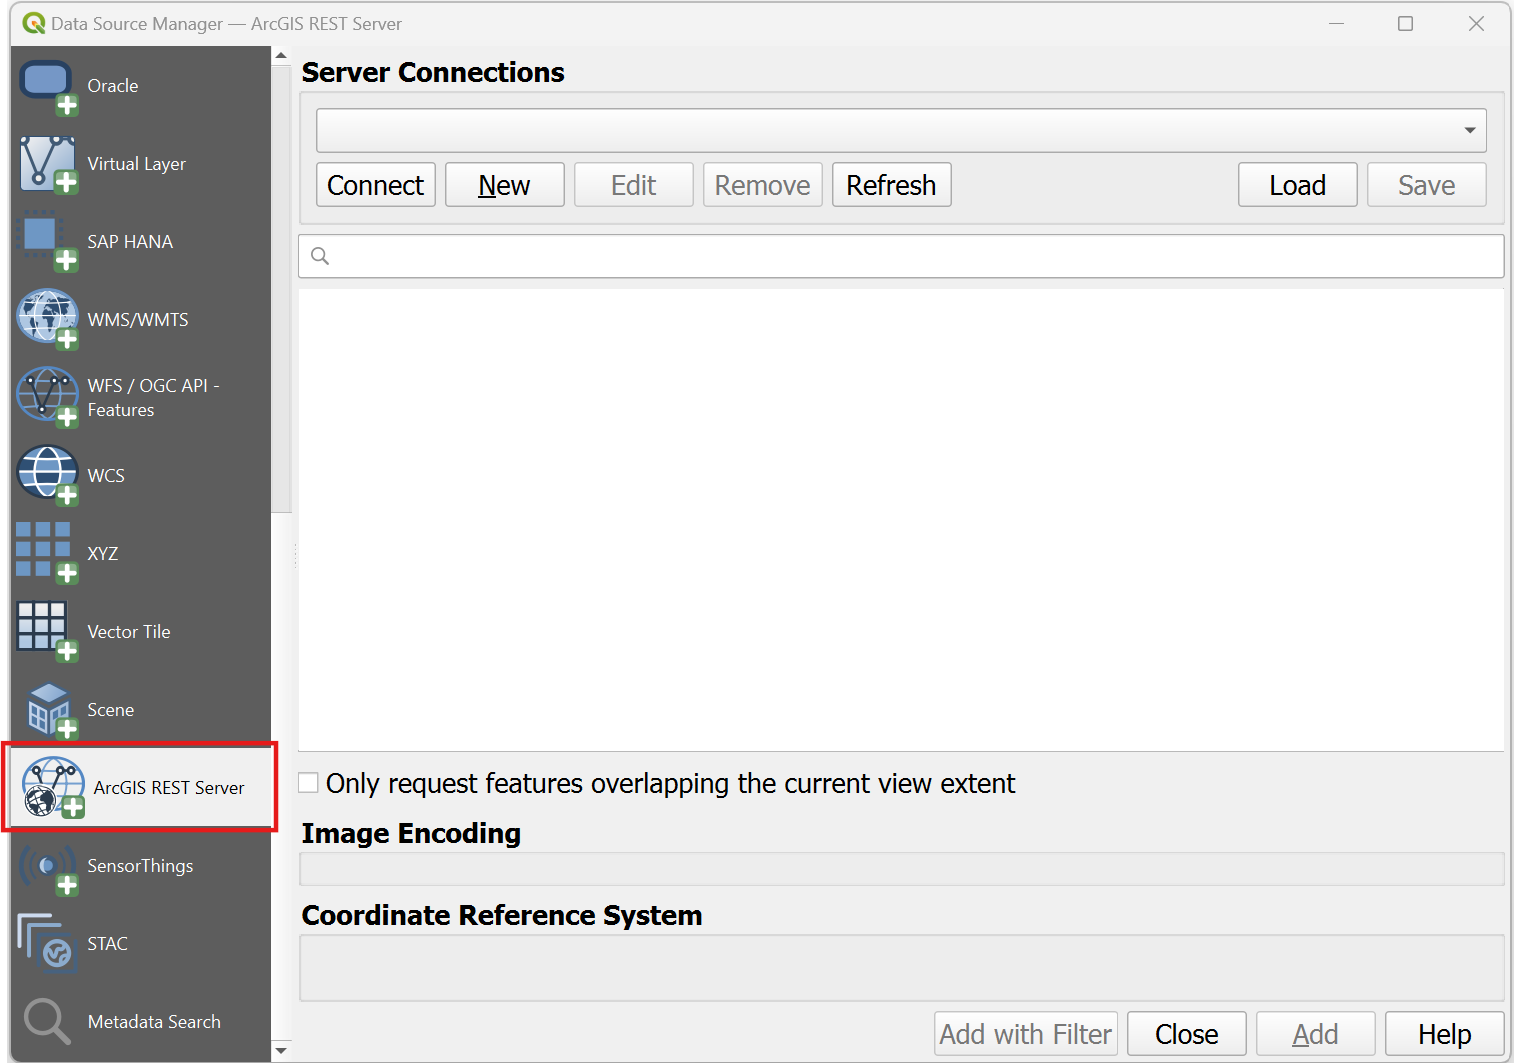
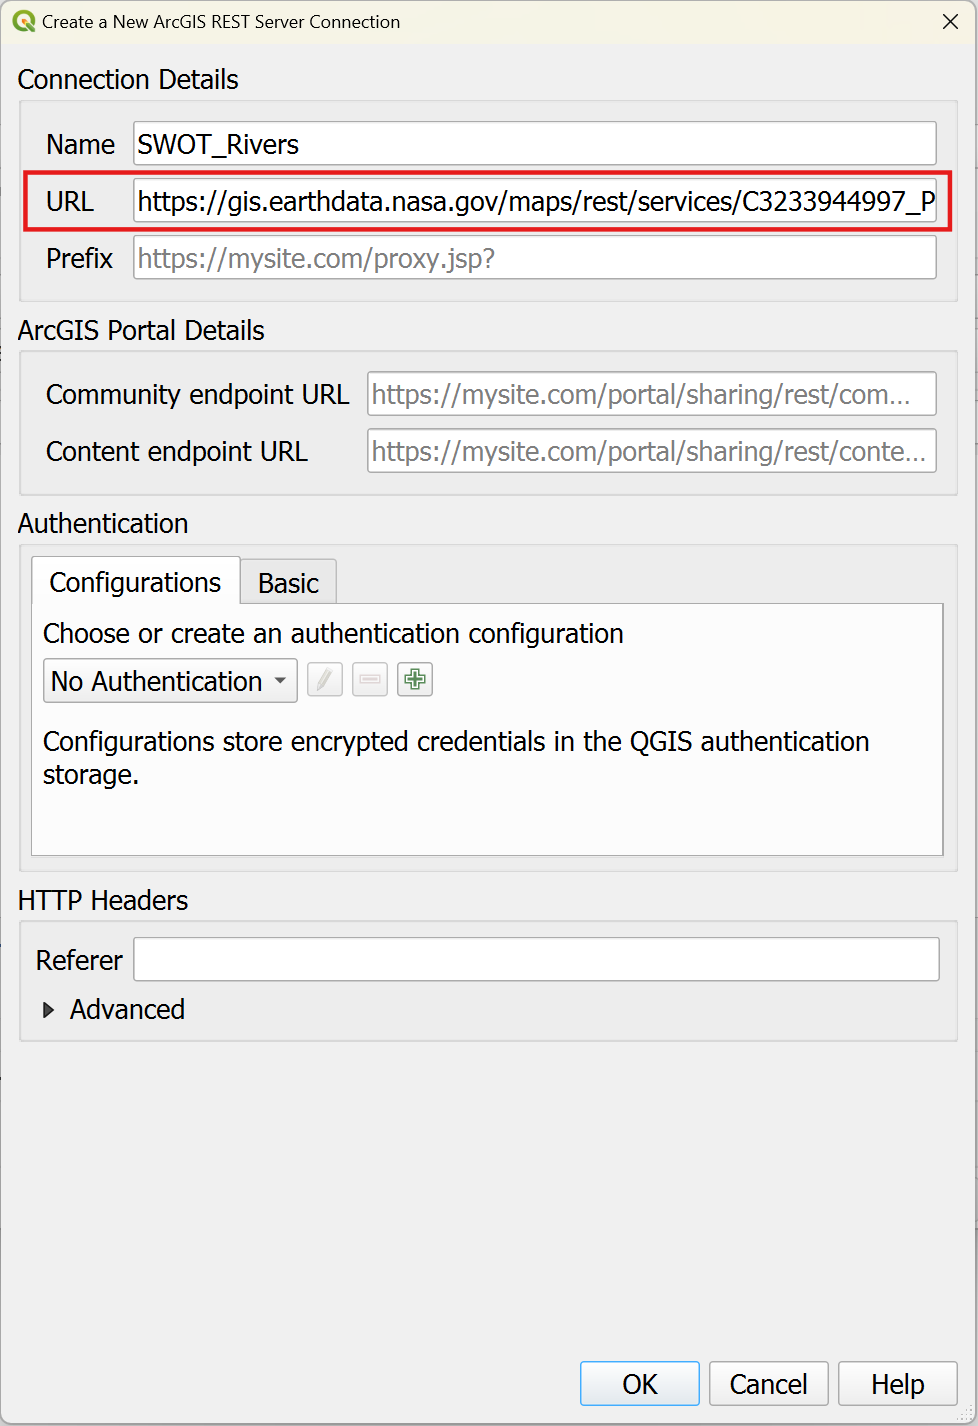
Within the Data Source Manager window select ArcGIS REST Server then New which is where the endpoint URL will be inputted.
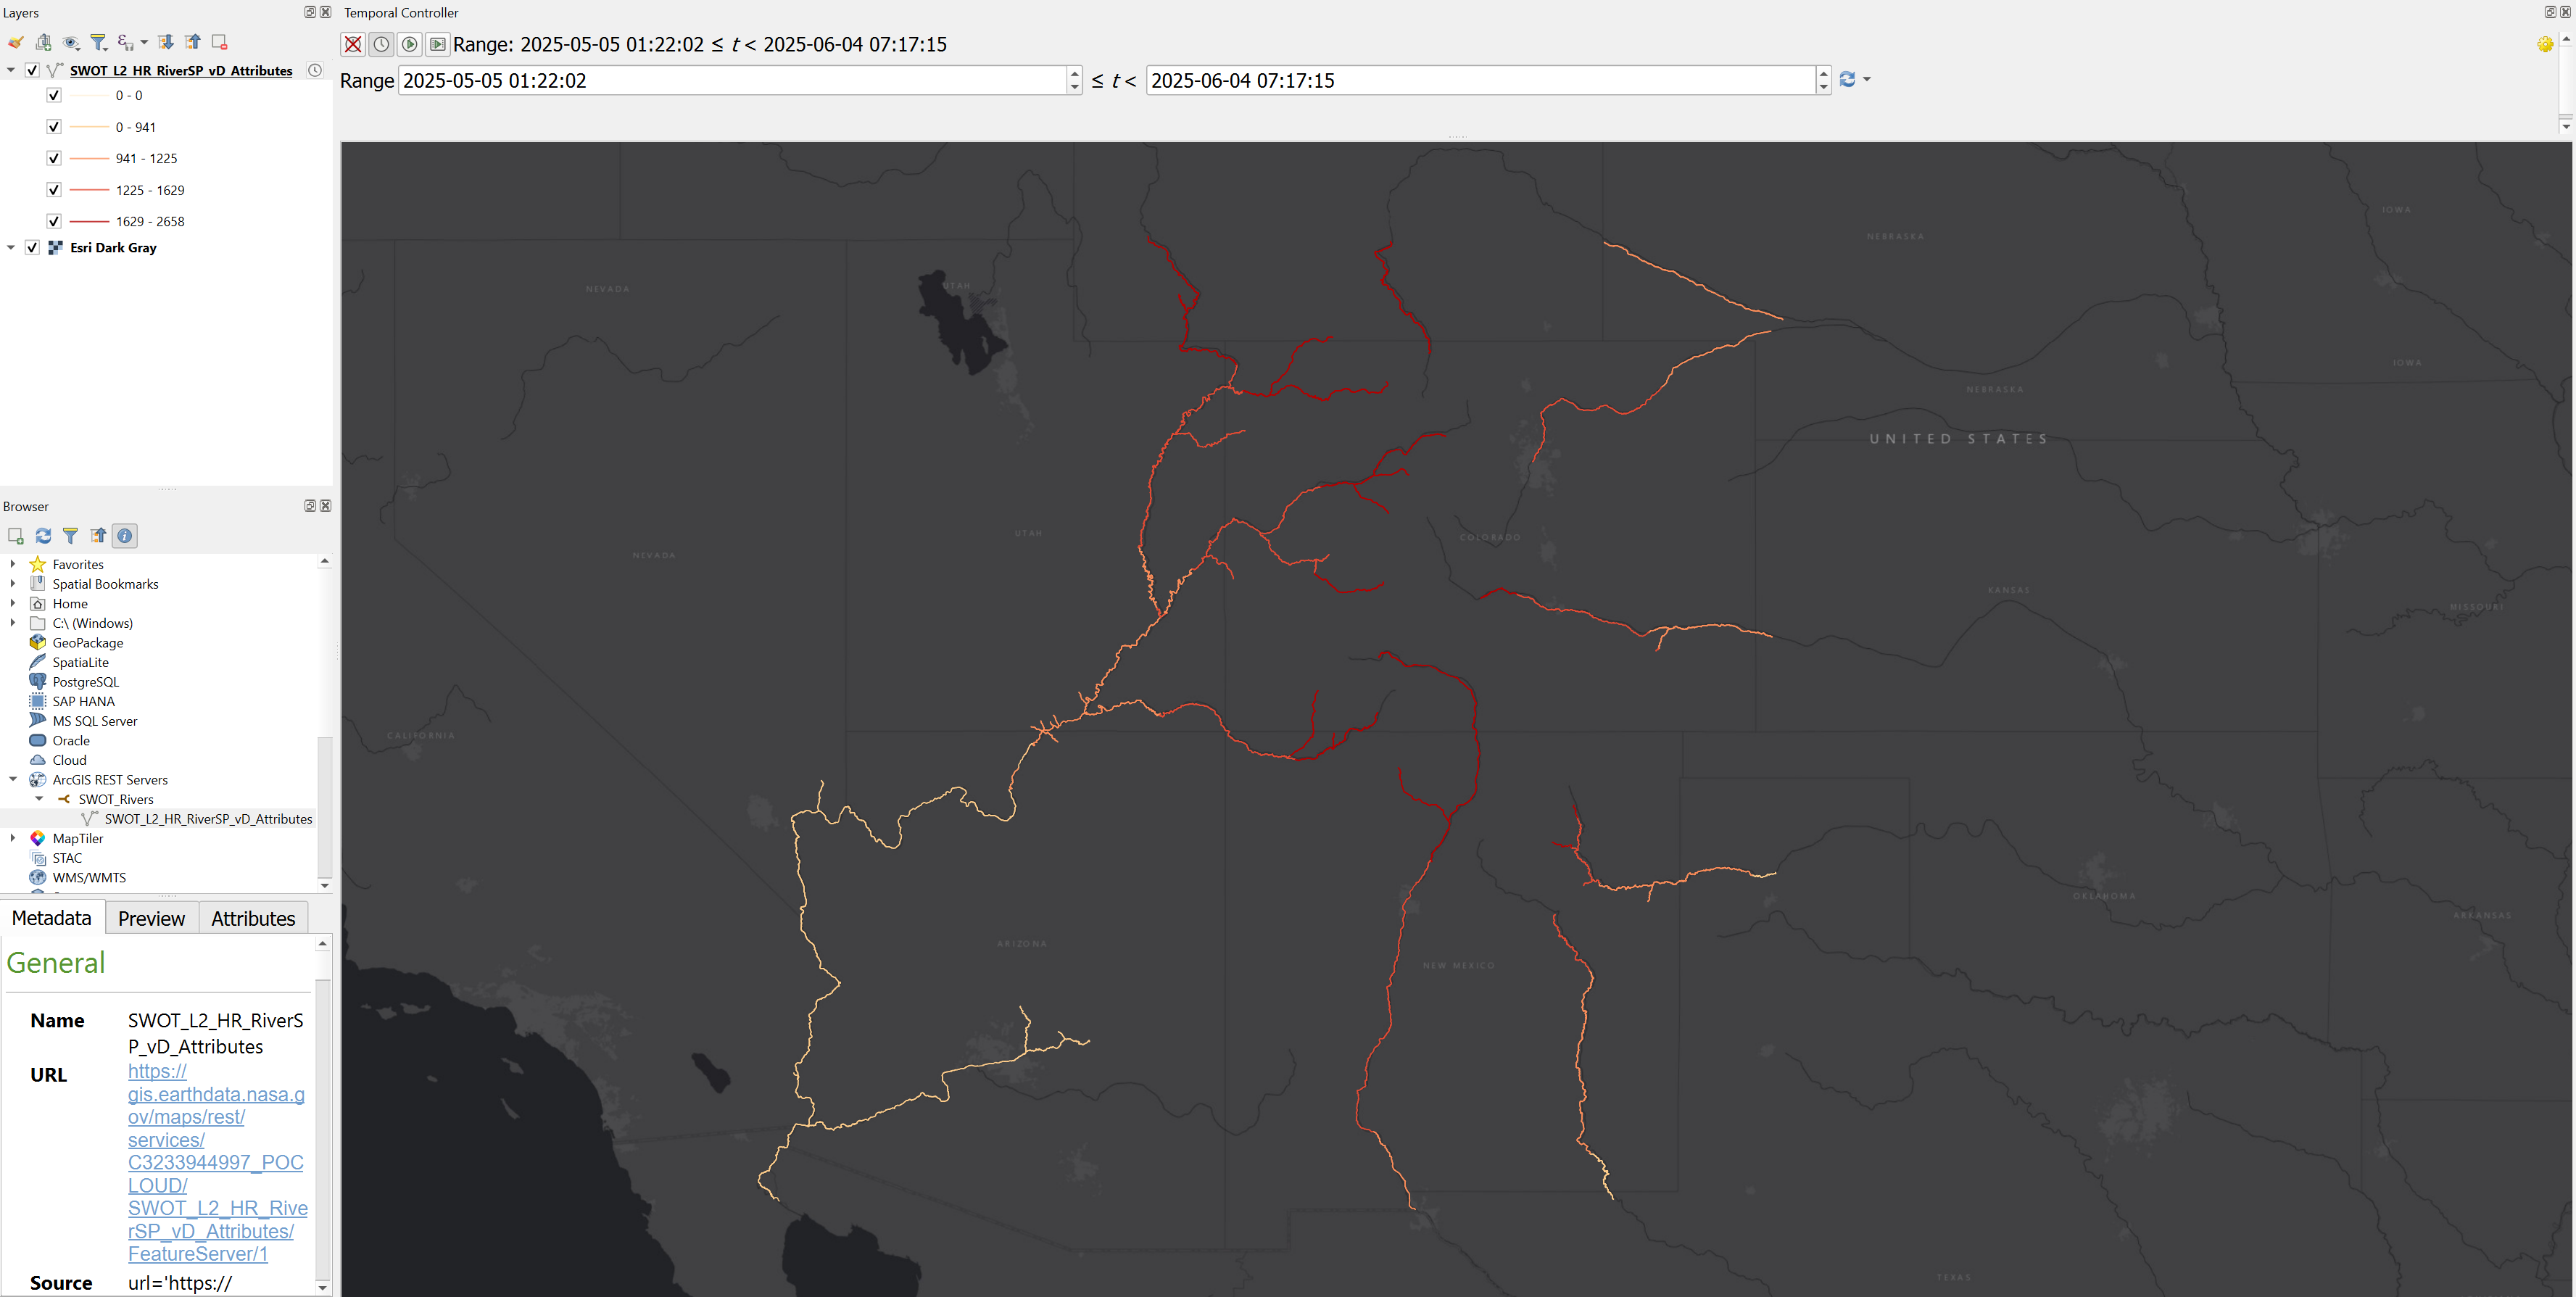
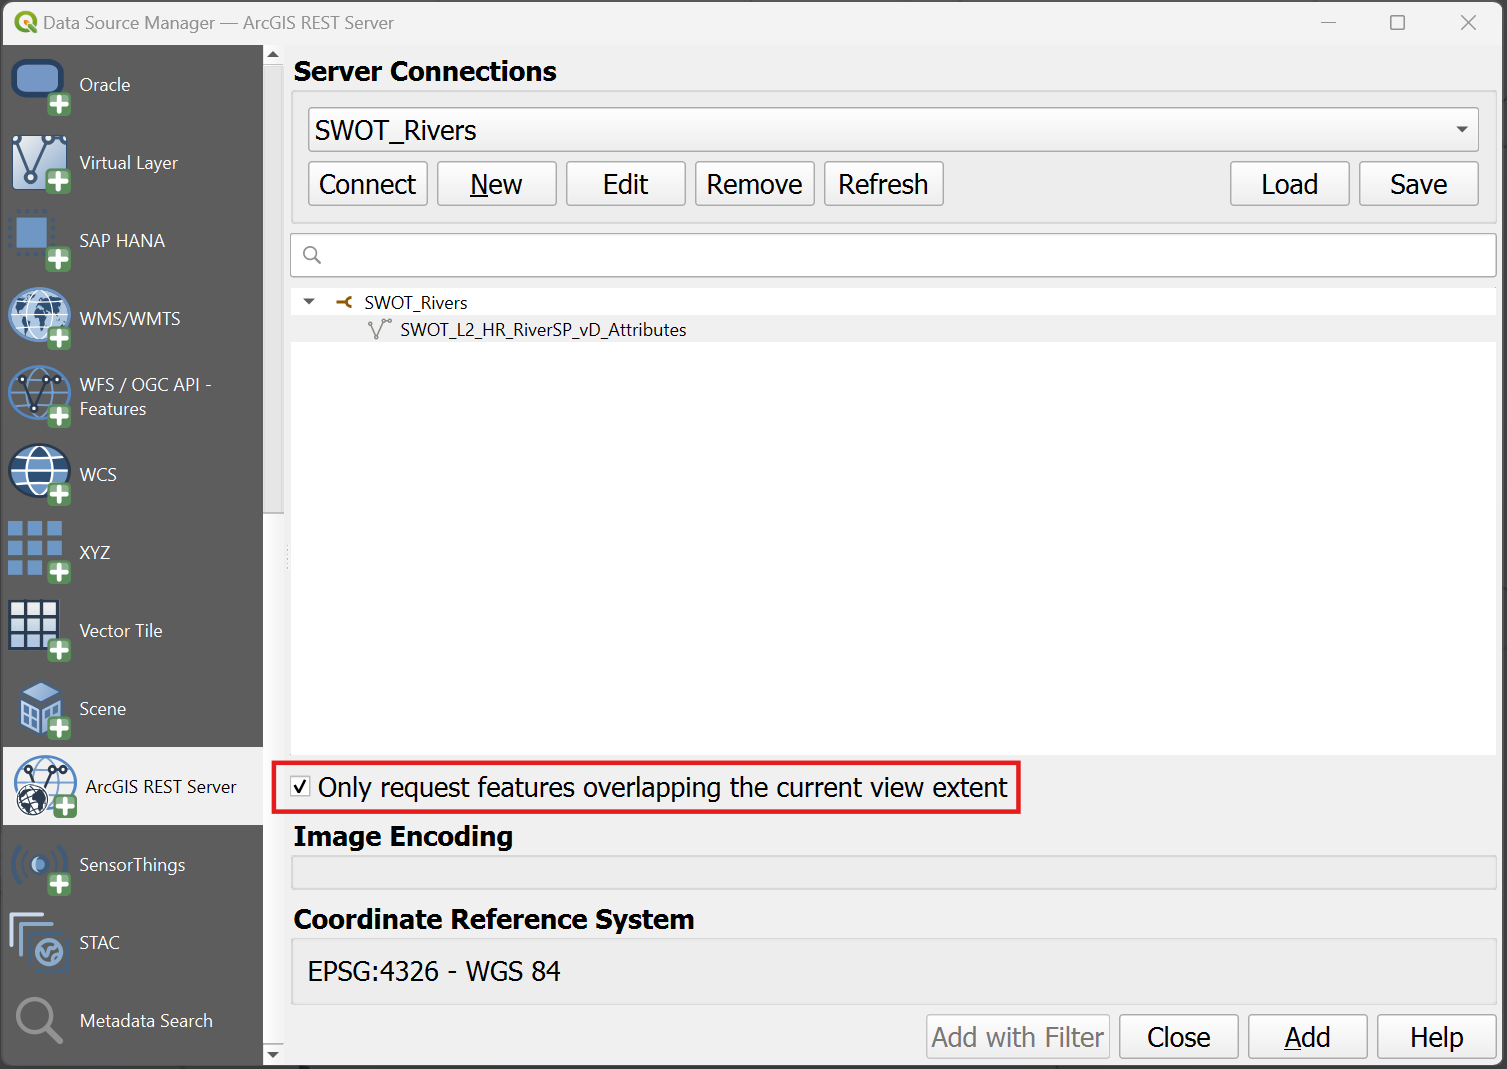
Once the new connection has been created, on your map, zoom in to the extent of the area you would like to view. Then within the Data Source Manager select the connection and enable Only request features overlapping the current view extent.
This will return only the features within the extent of the area of interest which will vastly improve the data request rate and allow you to conduct quicker analysis on the feature.
Time Series Charting
Creating a time series chart is possible in both ArcGIS Pro and QGIS.
ArcGIS Pro
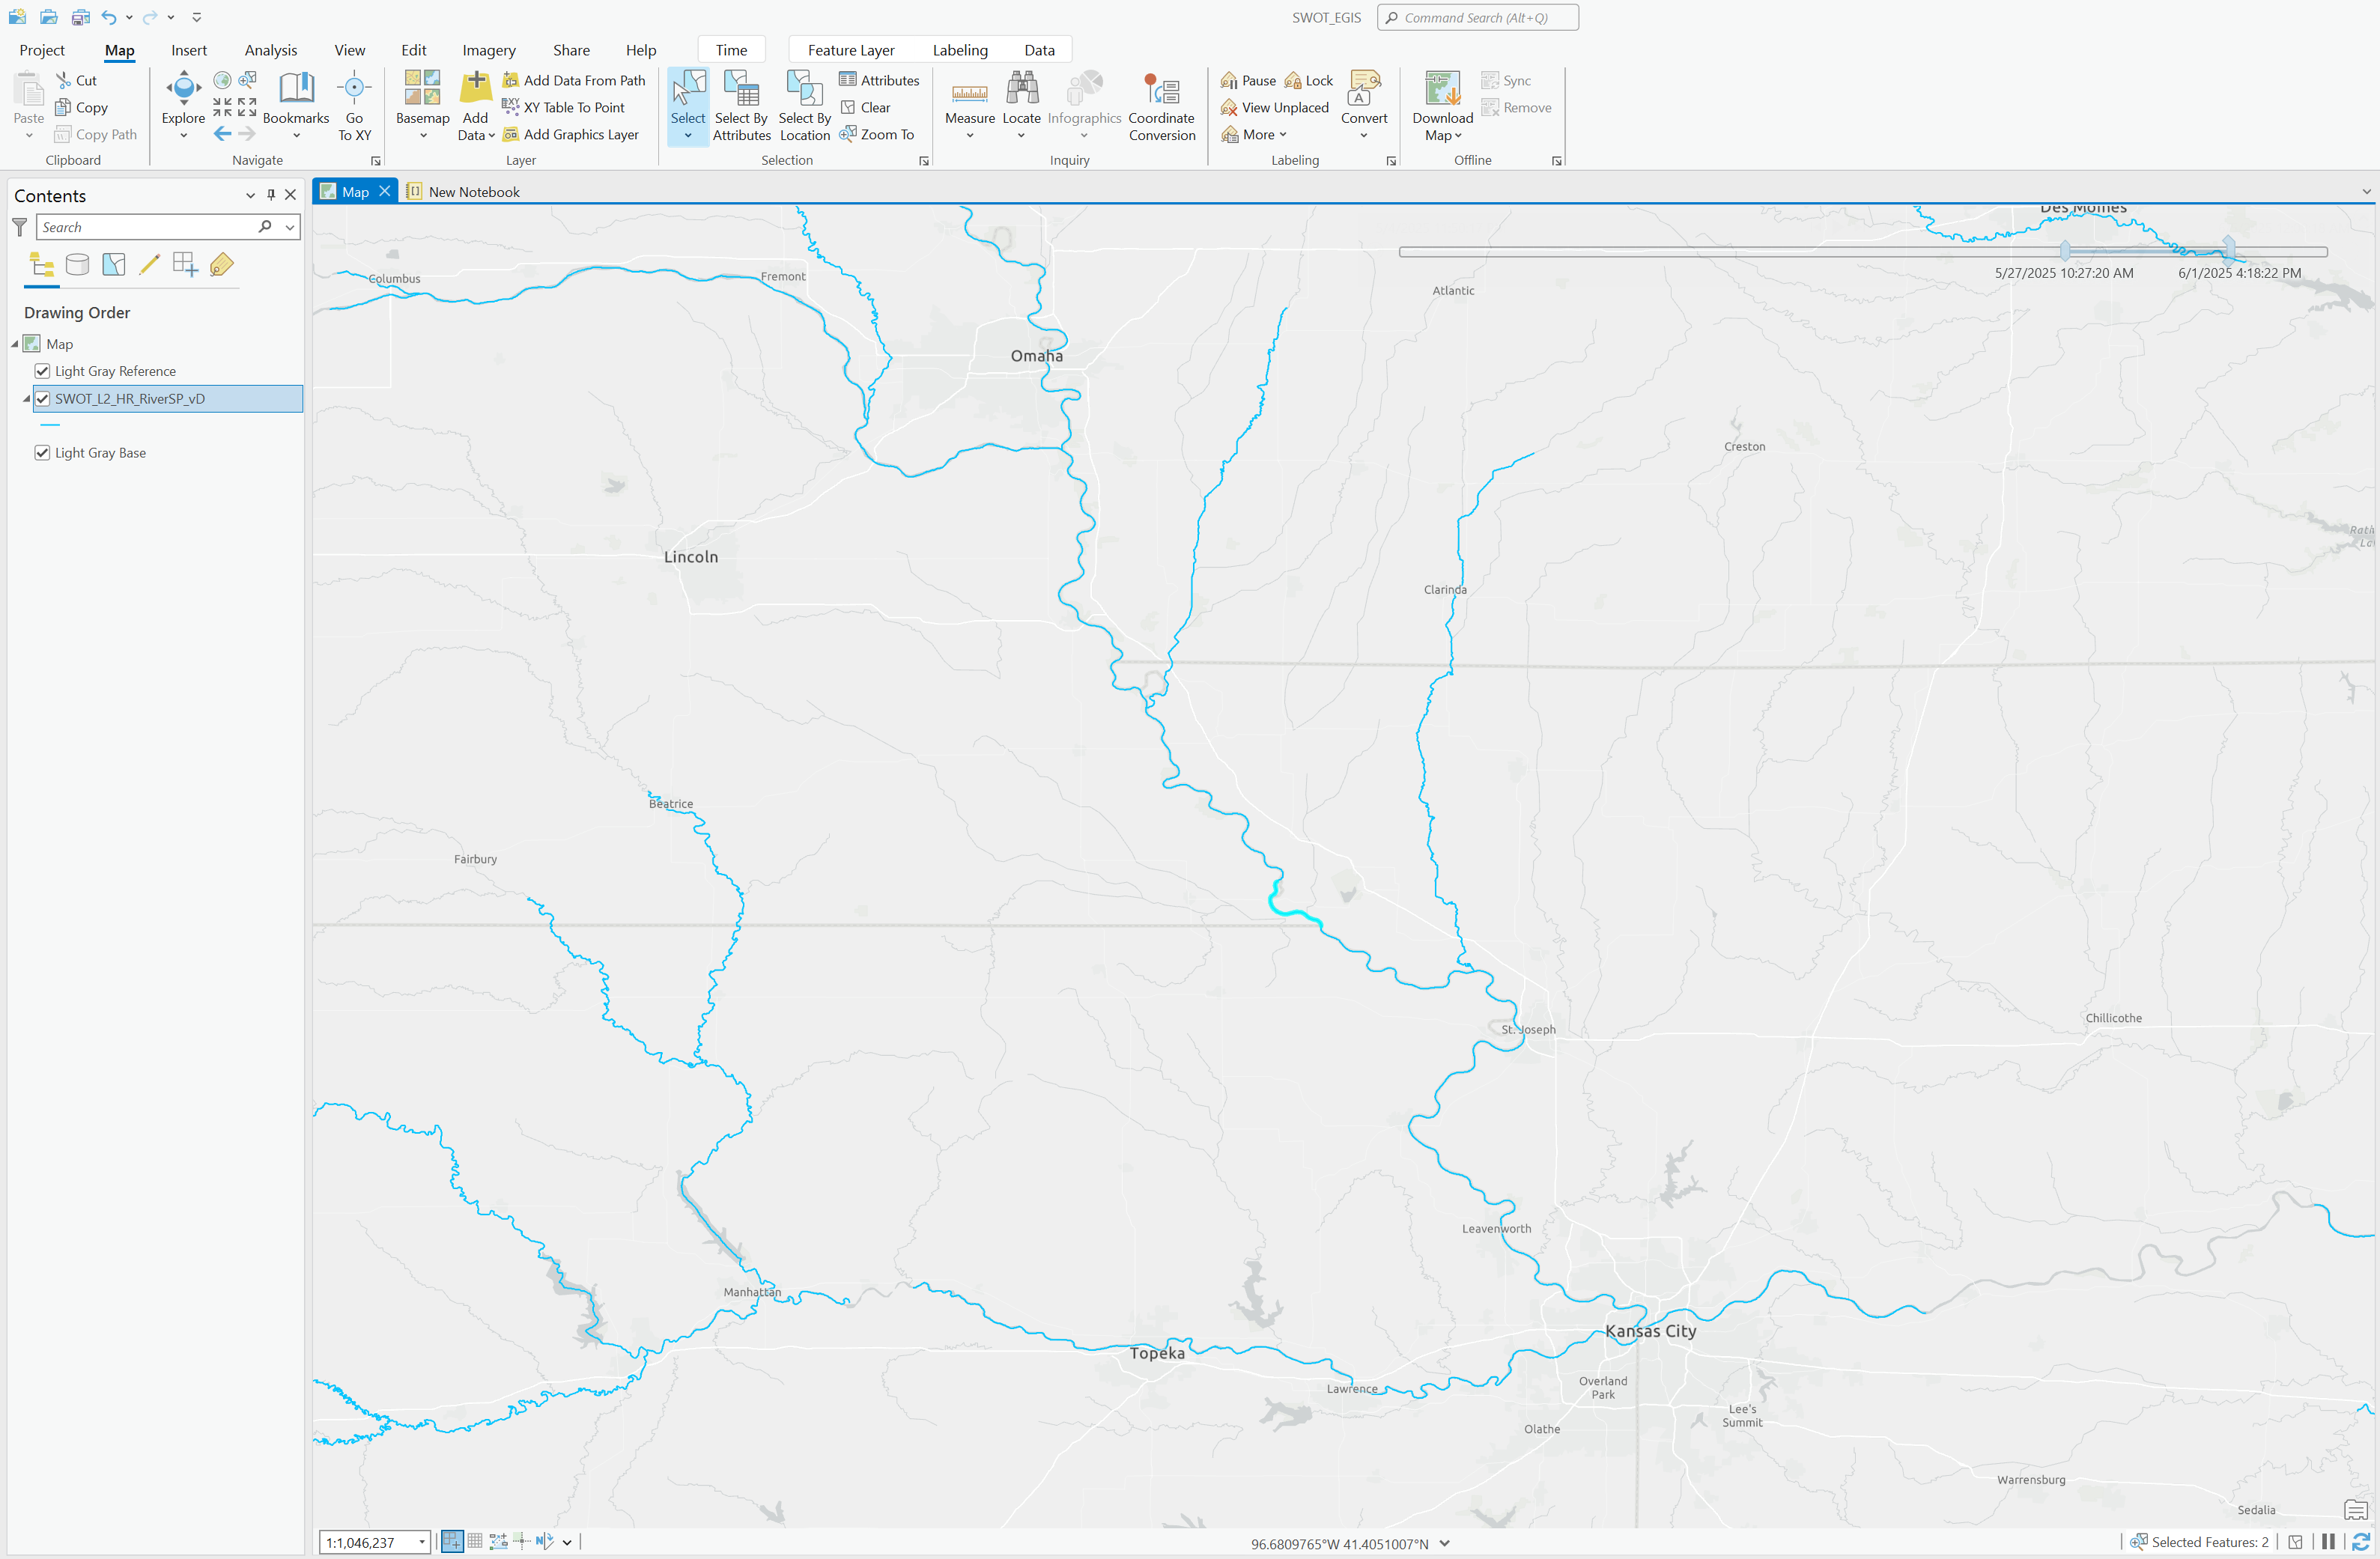
For ArcGIS Pro it is recommended to reduce the time scale to a desired period first, as well as selecting a specific river reach with the selection tool.
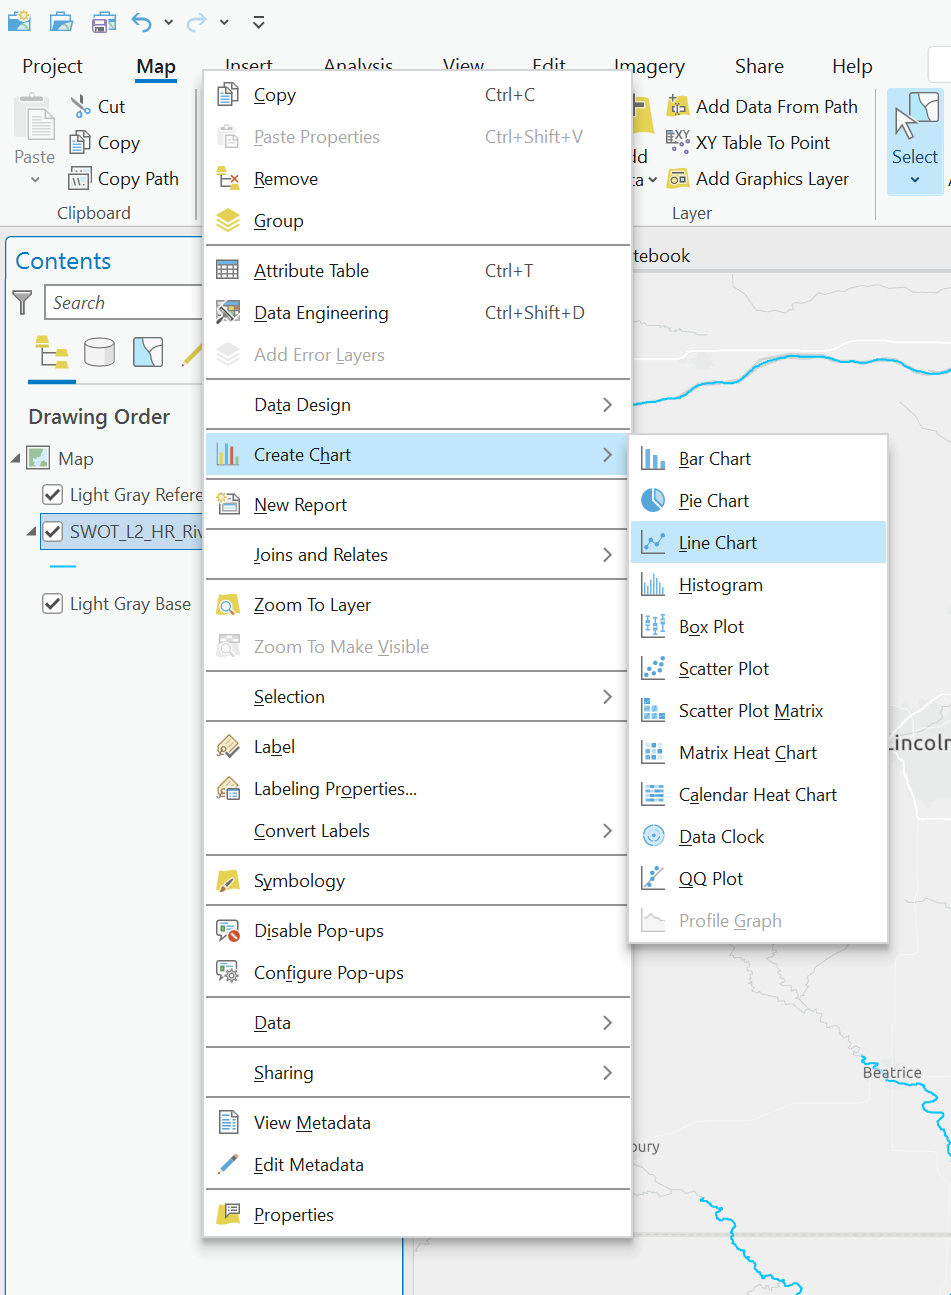
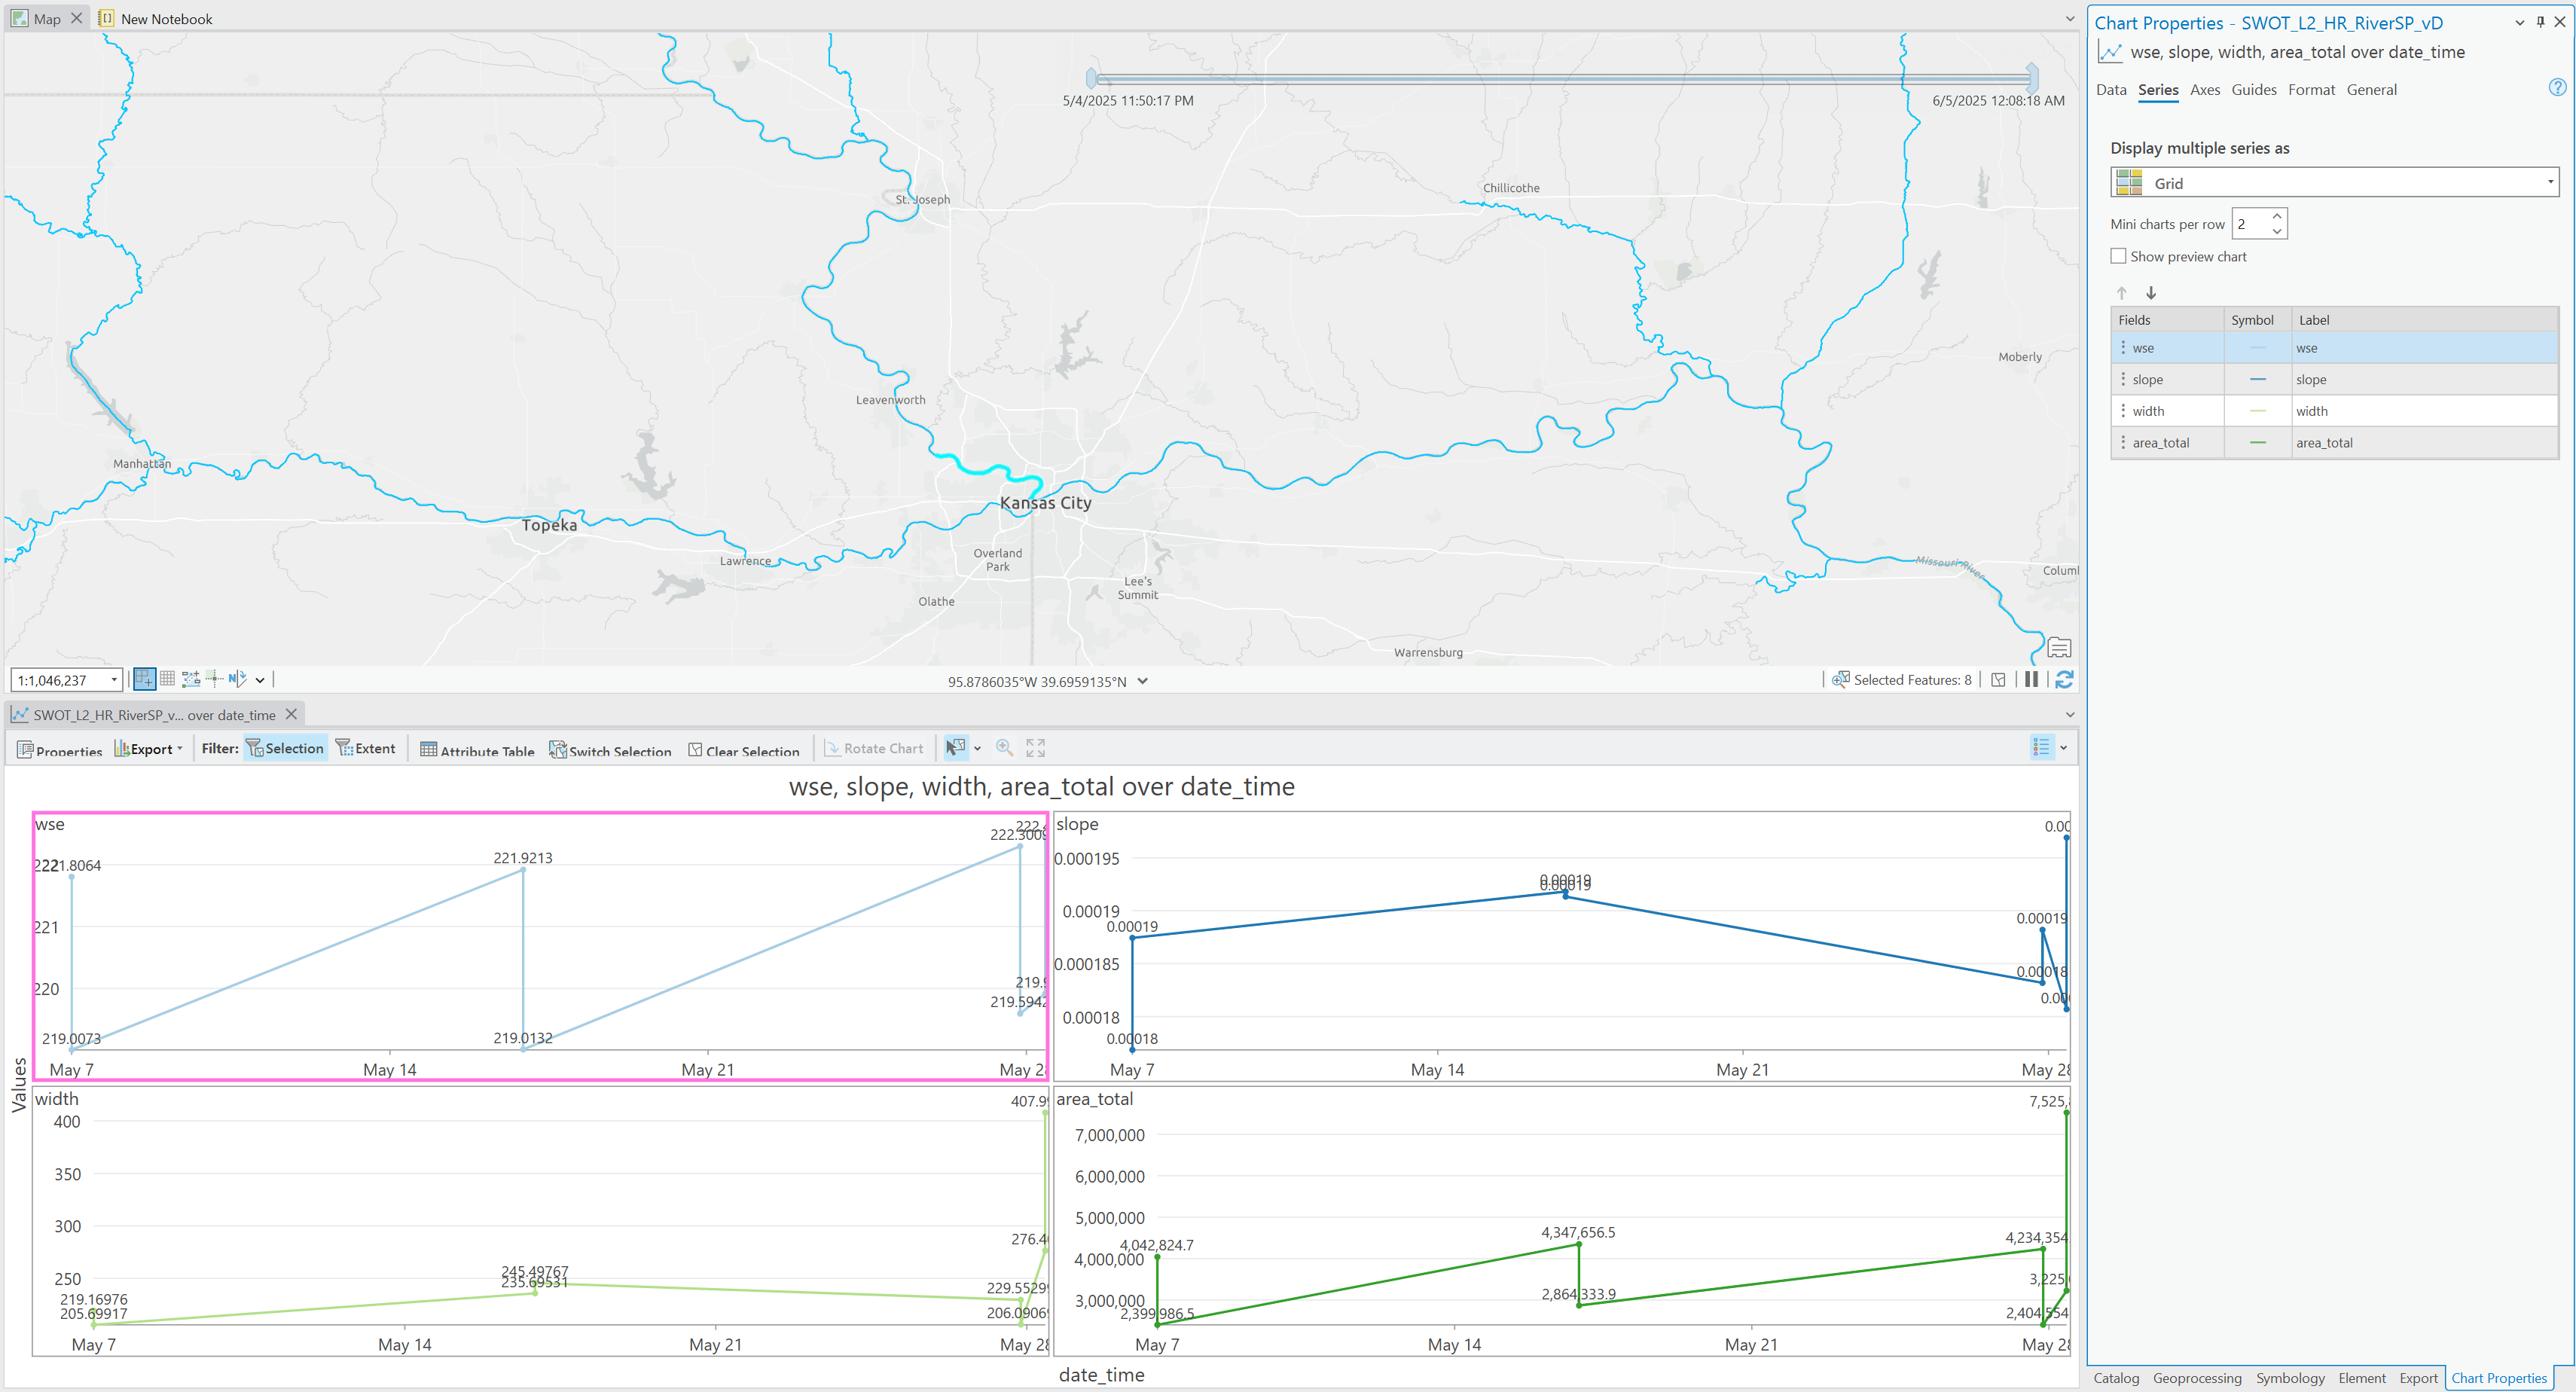
Once a river reach is highlighted, right click the layer in the Content pane and hover over Create Chart and select Line Chart.
Before selecting any Chart Properties select Filter by Selection first so the chart can be created based on the selected reach. Then select date_time with no aggregation and Numeric Fields which will provide a list of the available dataset attributes.
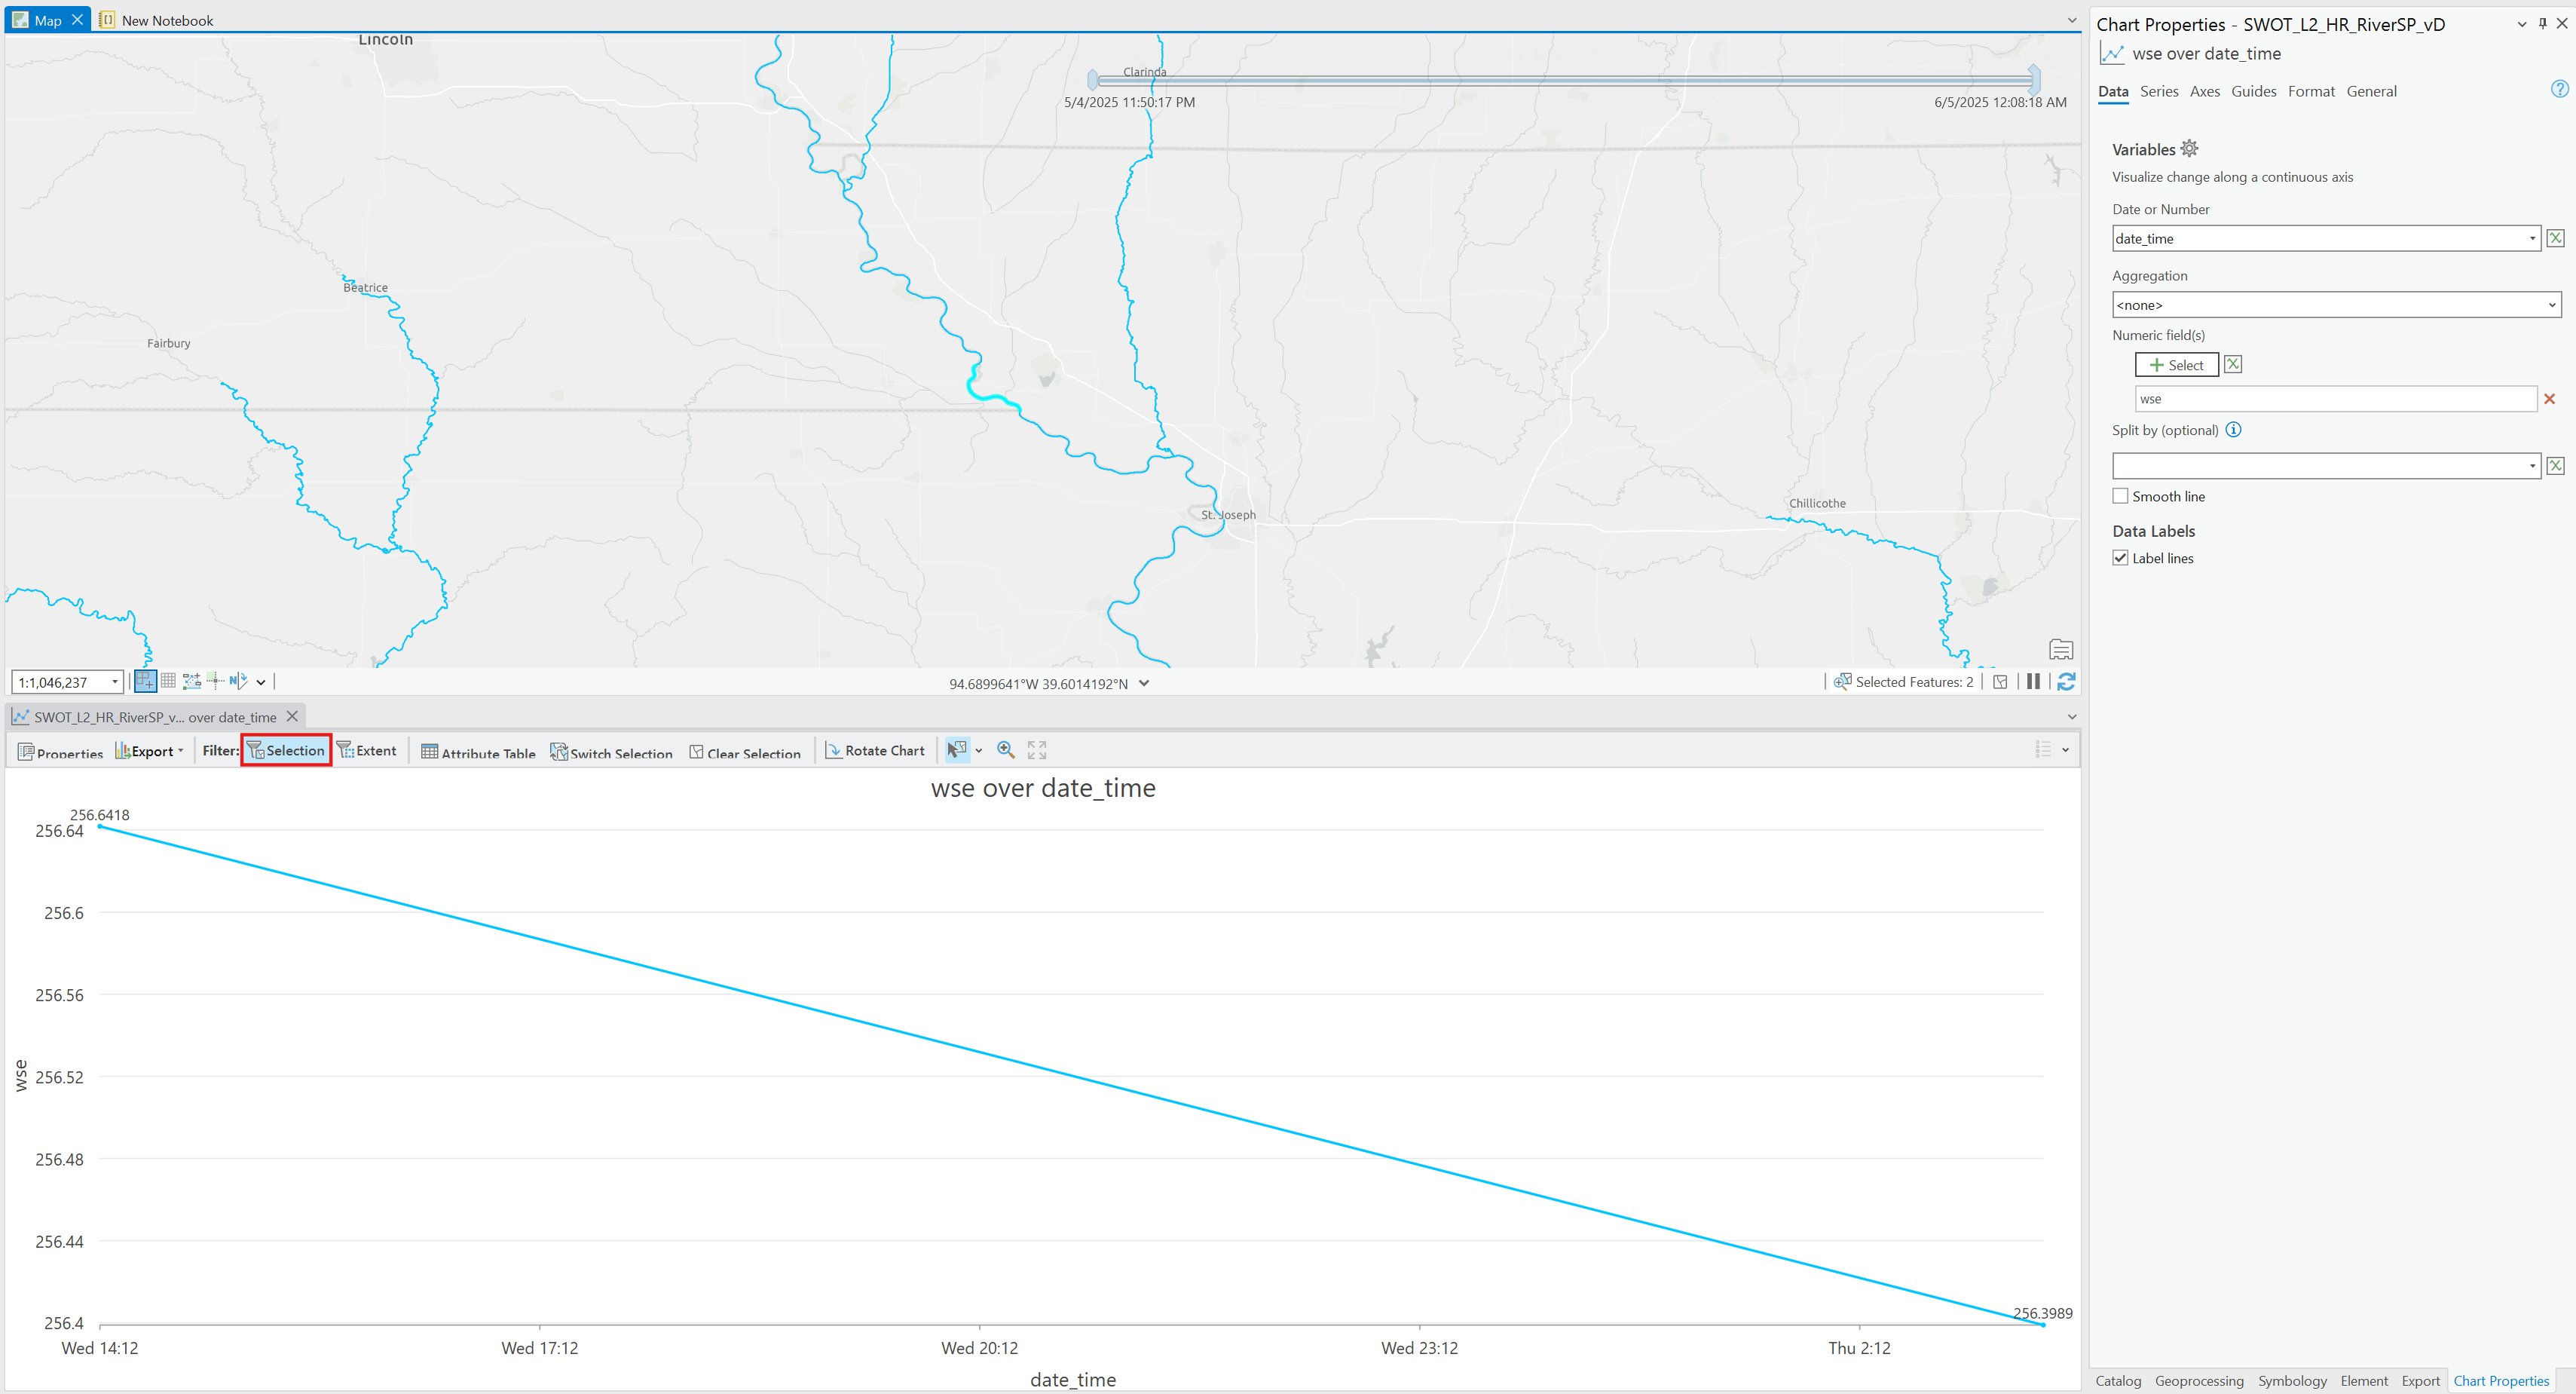
Once the chart properties are configured, you can expand the time scale and also select multiple river reaches and configure mulitple charts.
QGIS
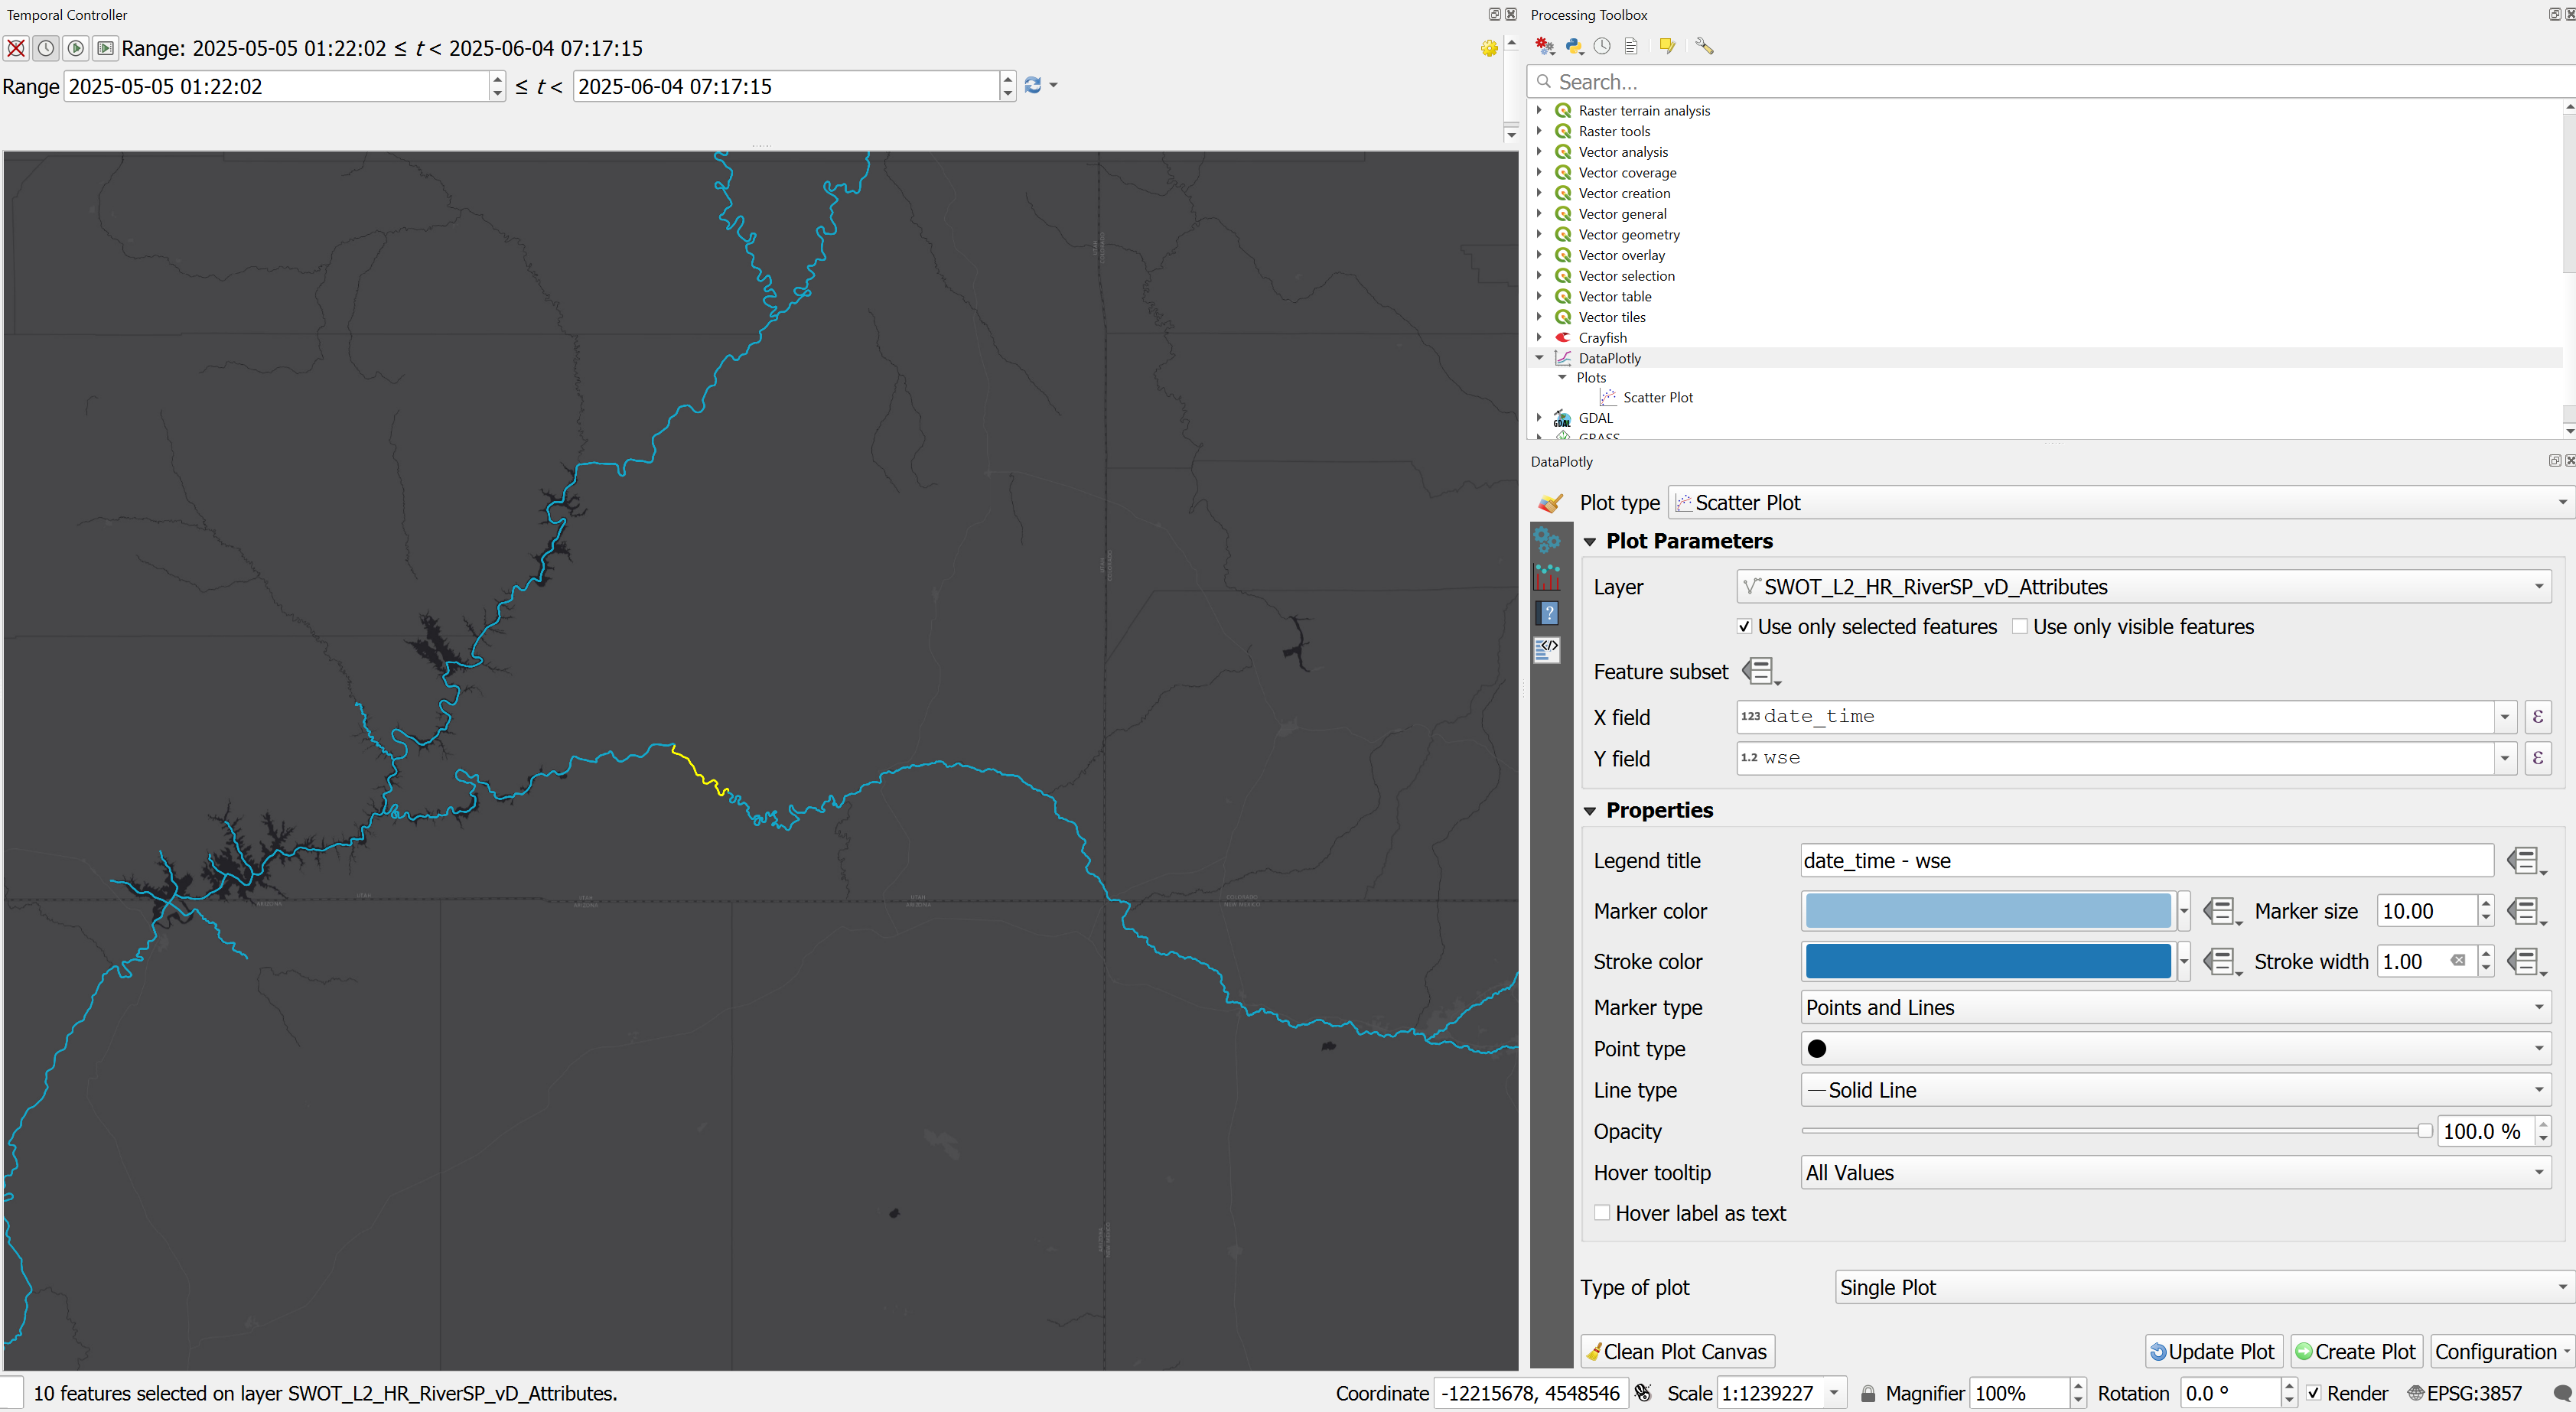
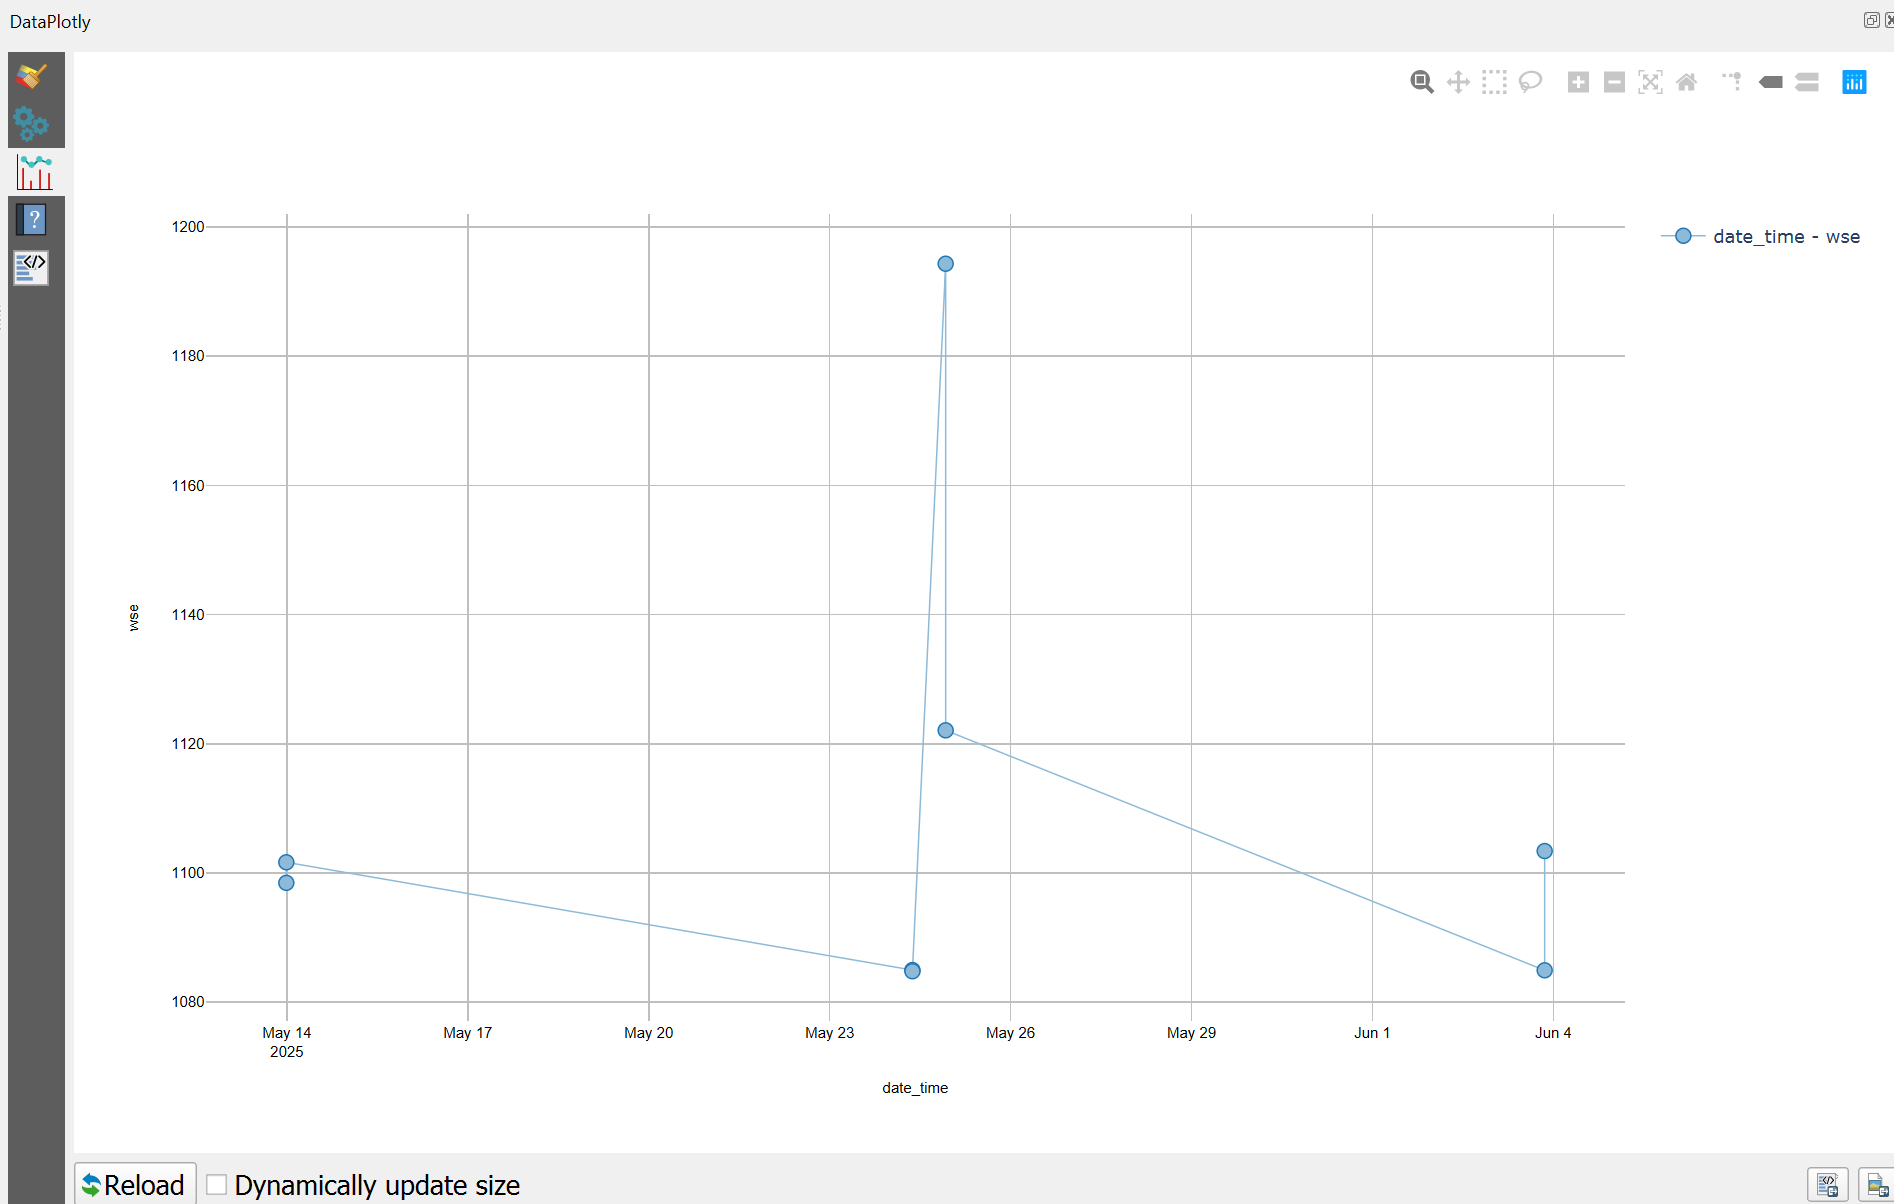
For QGIS, there is a plugin option called DataPlotly, which utilizes the python library Plotly.
This will provide the option to create a time series chart within QGIS. Highlight a desired river reach and select a Scatter Plot. Input date_time in the X field and (for example) wse in the Y field then select Points and Lines for the Marker type. This creates a time series of the attibute wse (water surface elevation).
Symbology
We also have the option to change the symbology based on the variety of attributes available.
ArcGIS Pro
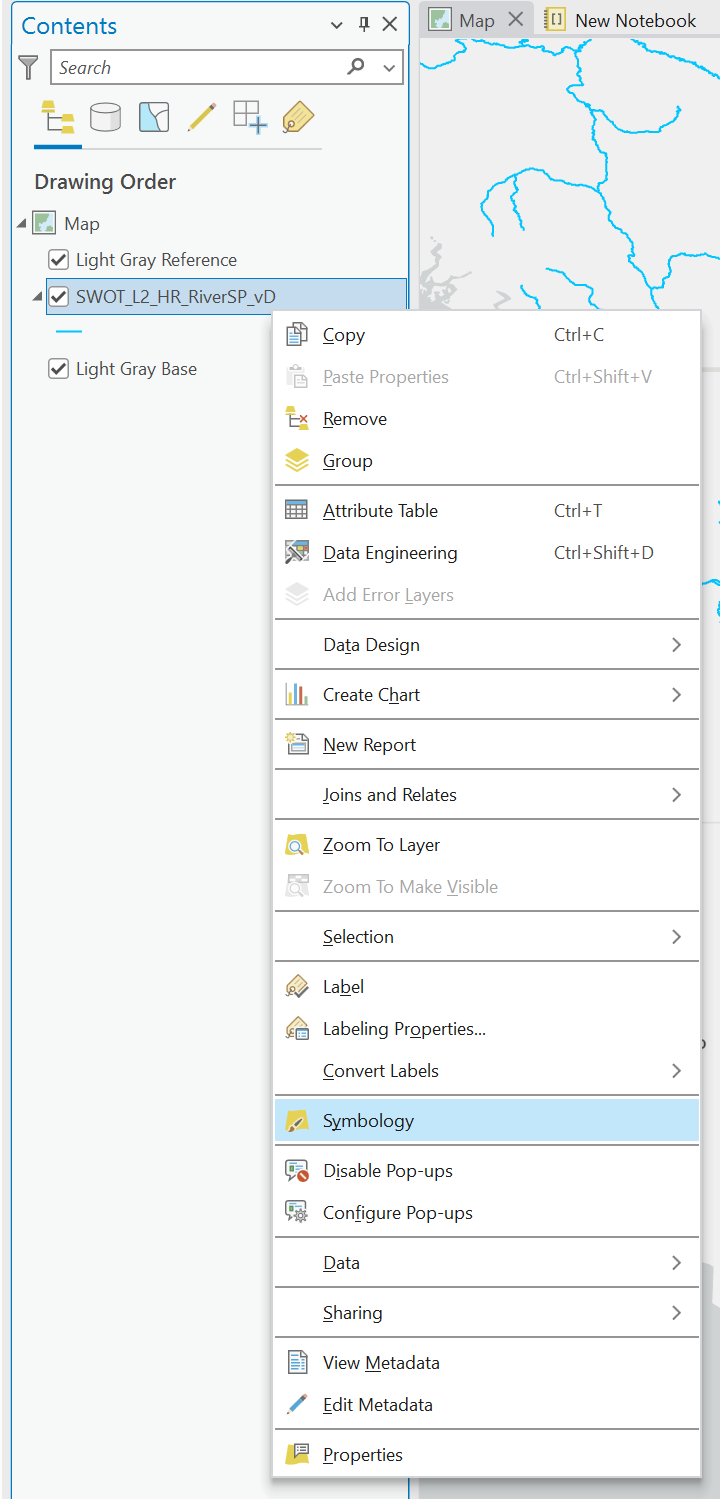
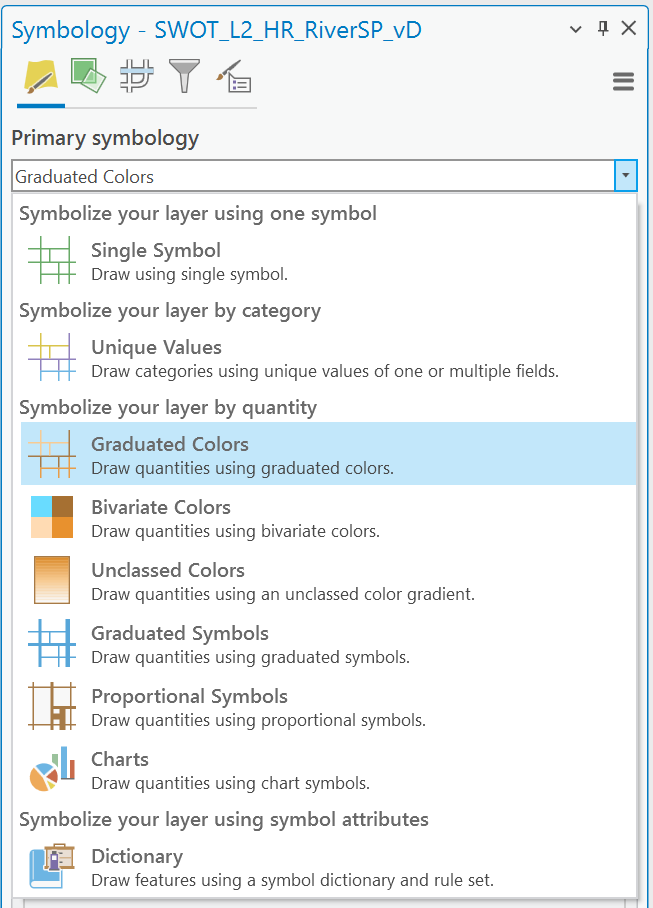
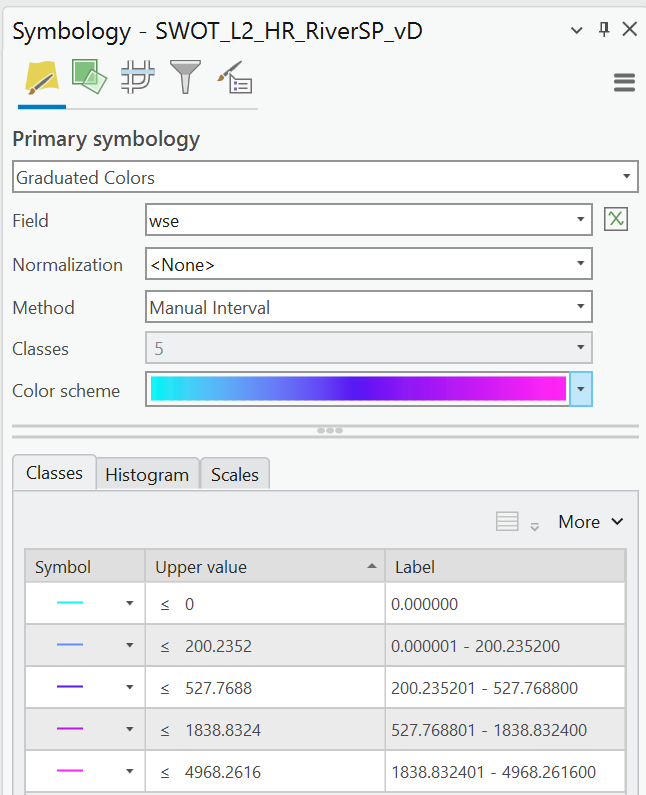
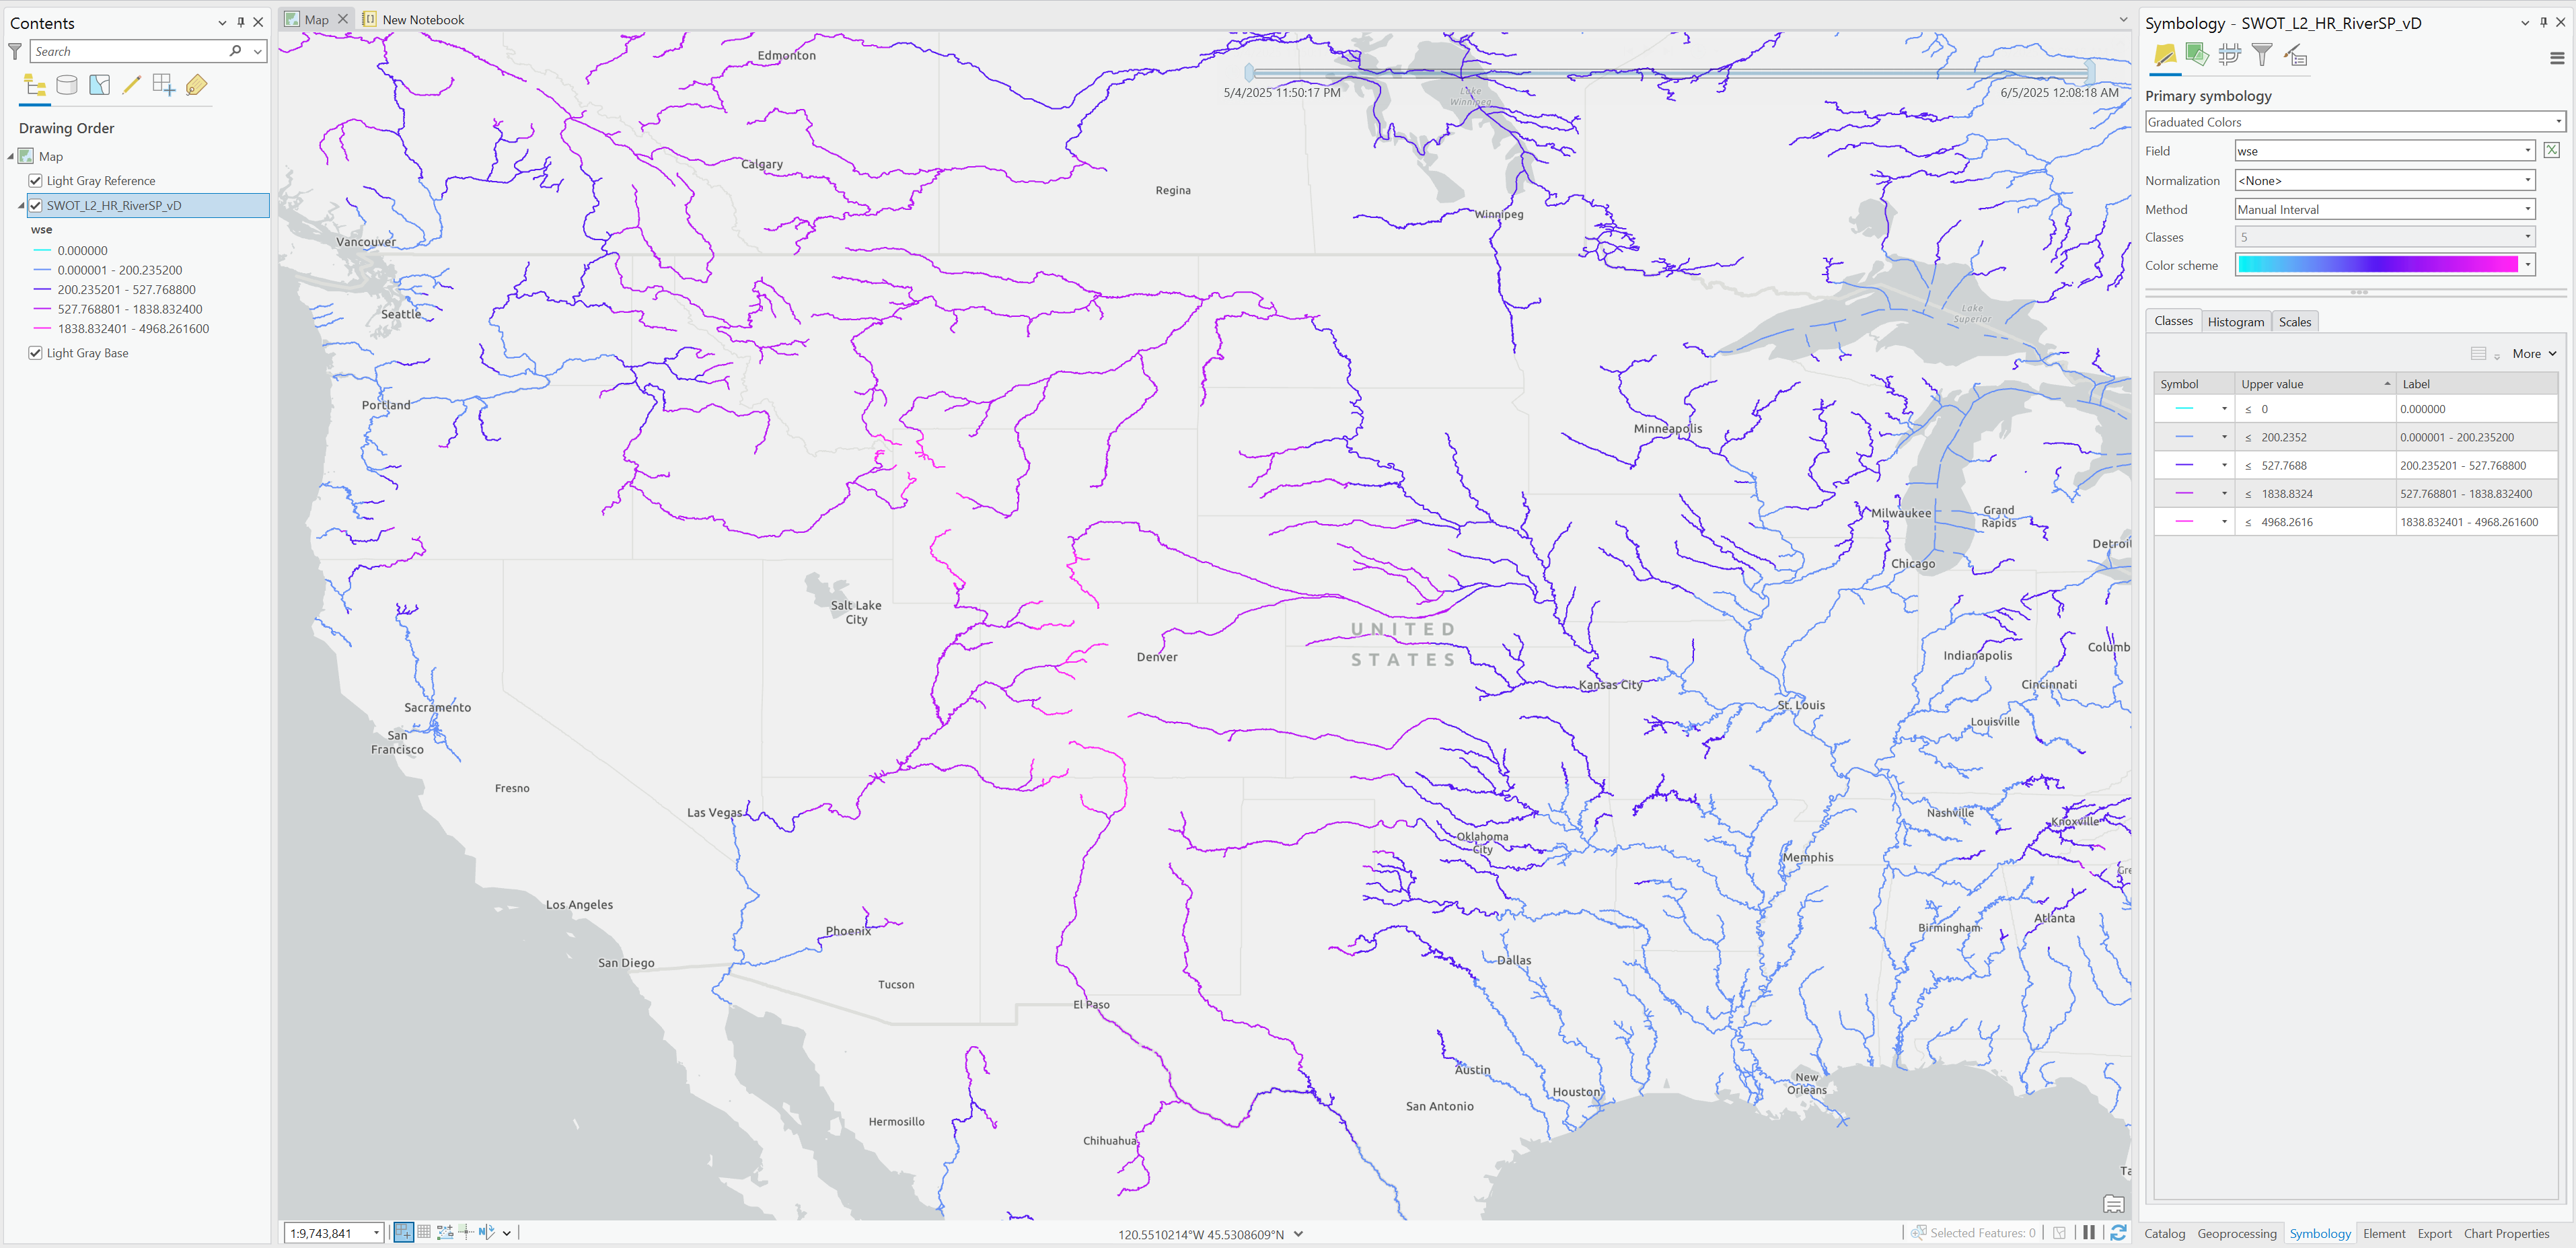
Right click the layer and select Symbology which provides different options to visualize the layer we have selected; here we chose Graduated Colors.
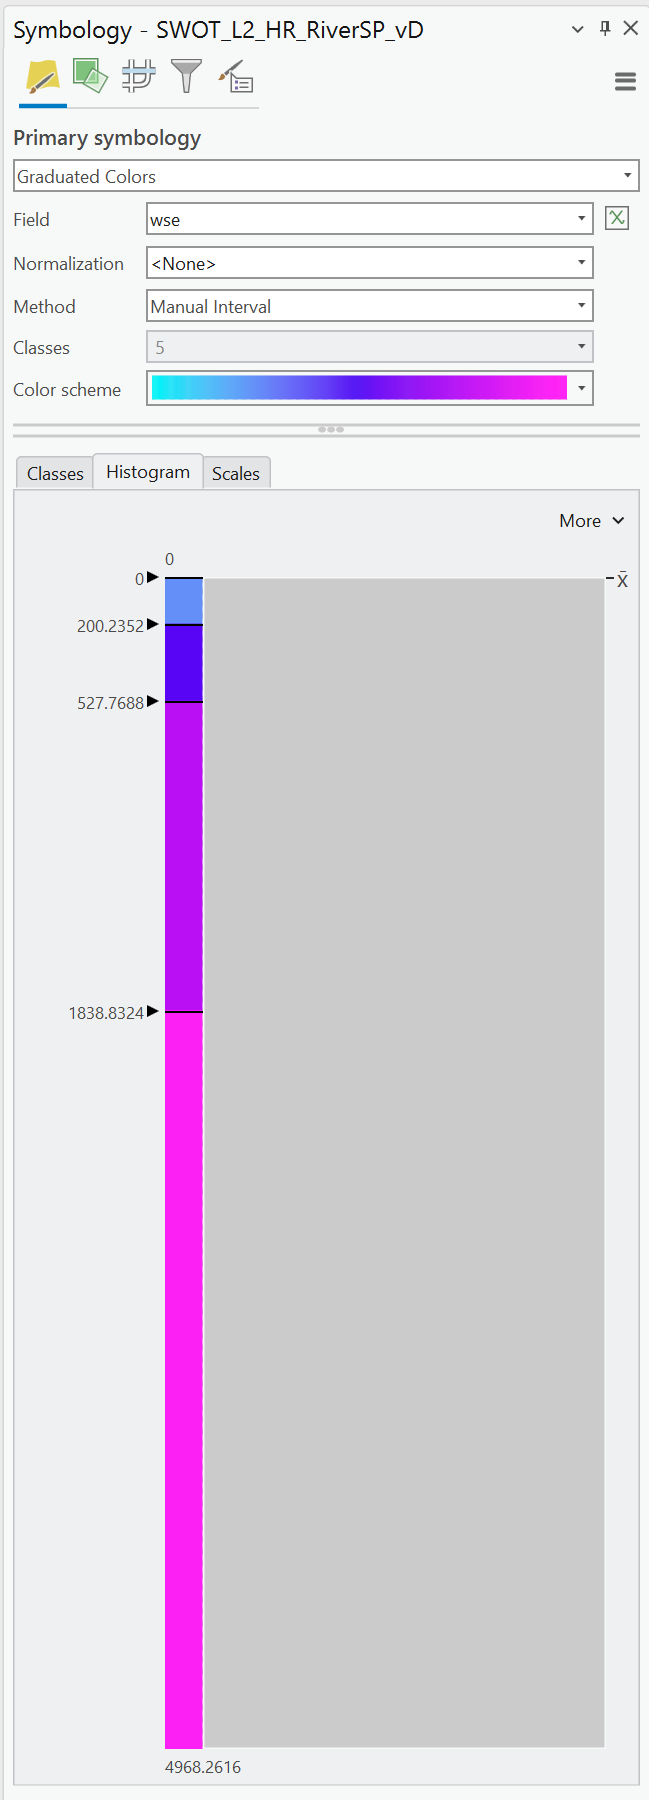
For the selected variable Water Surface Elevation (WSE), we can clean up the -999999999999 fill values. Within both the Histogram and Upper Value you can set it to only show values with 0 and above.
QGIS
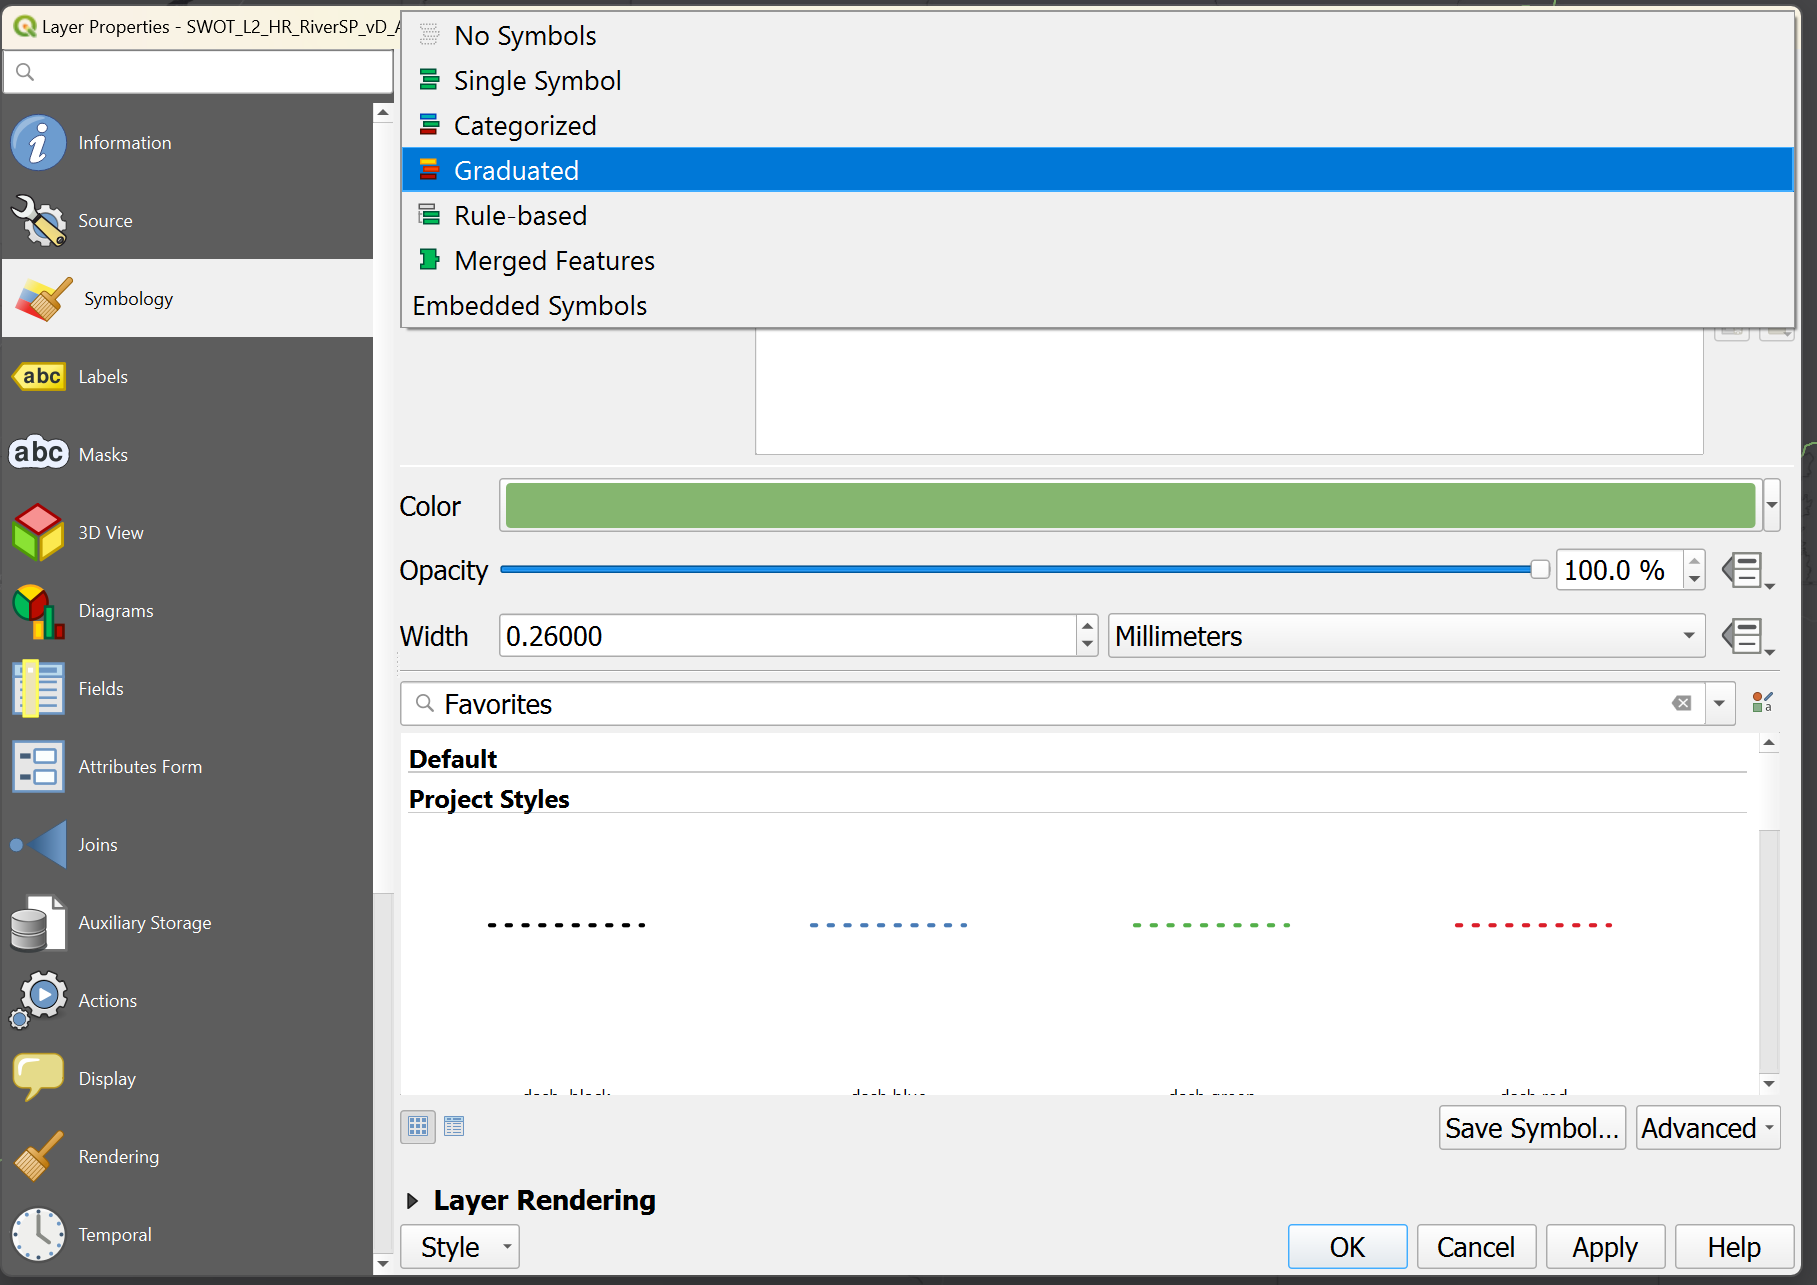
For QGIS, right click the layer and select Properties which will provide access to the Symbology settings.
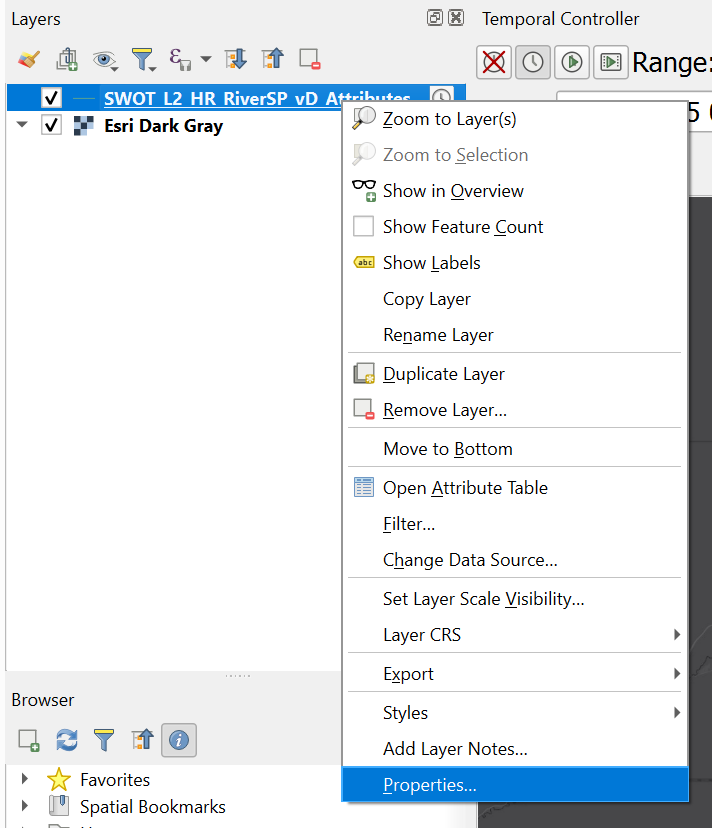
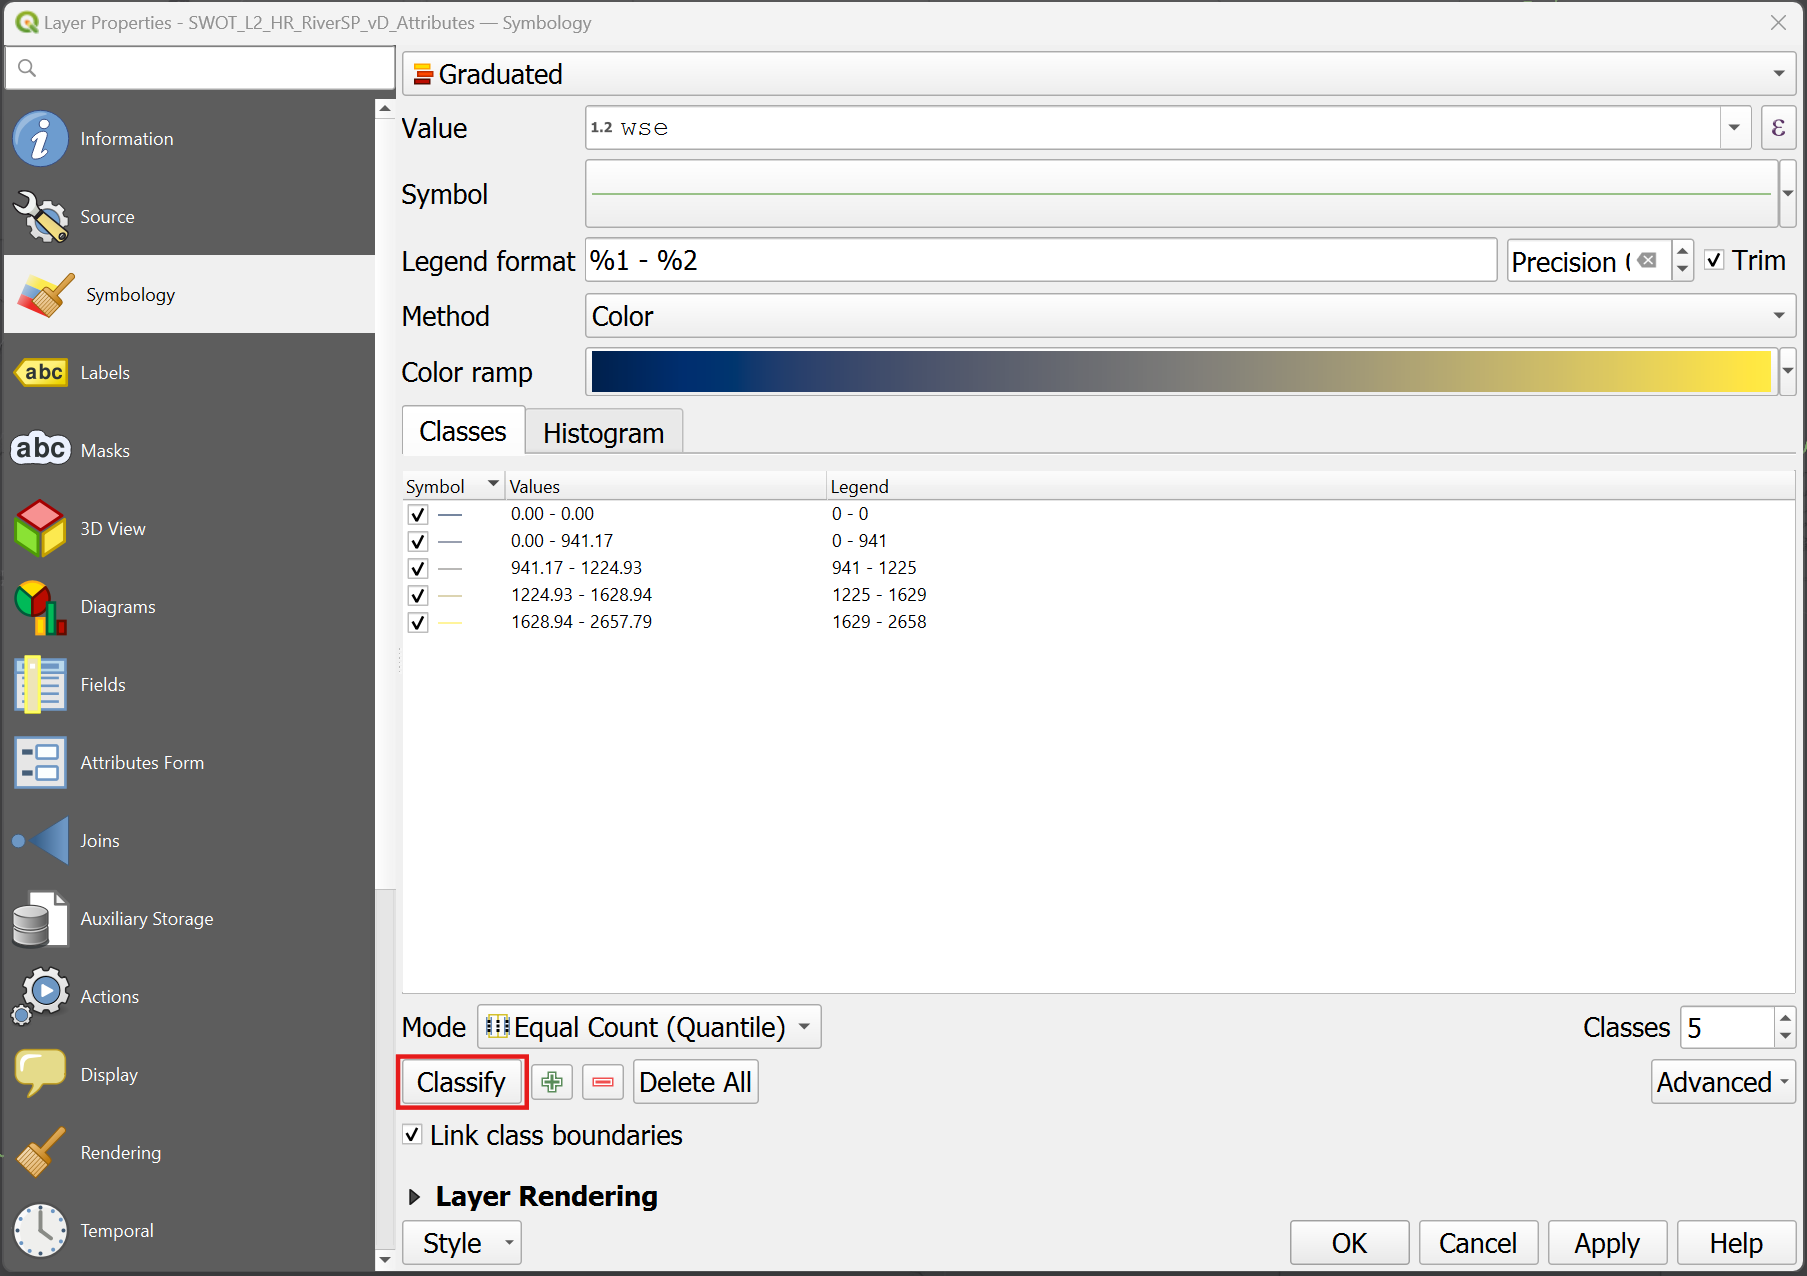
There are a variety of options to change the symbology of the layer, here we selected Graduated. Select the value WSE and click the Classify button so it provides the values for the 5 classes. We will also clean up the fill values here and input 0 in the Values section.